

1. Daily technical analysis of selected currency pairs
AUD/JPY Bearish
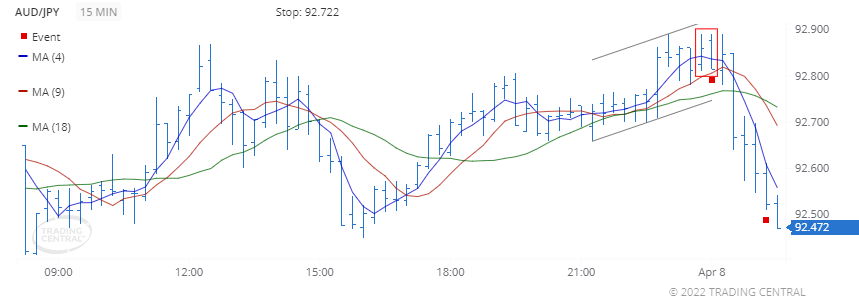
Image Features: forms “Inside Bar (Bearish)” pattern
Target
Opportunity recognized 2022 Apr 08 for the period of up to 12 hours
-0.343 (34.3 pips) price change since the Technical Event at 92.815
Technical Analysis
We found a pattern called Inside Bar (Bearish) on 2022 Apr 08 at 00:00 GMT on a 15 minute chart suggesting the outlook is bearish for up to 12 hours.
On 2022 Apr 08 at 01:15 GMT, the 4-bar Moving Average crossed below the 9-bar MA which crossed below the 18-bar MA, signaling a new downtrend has been established.
CAD/JPY Bearish
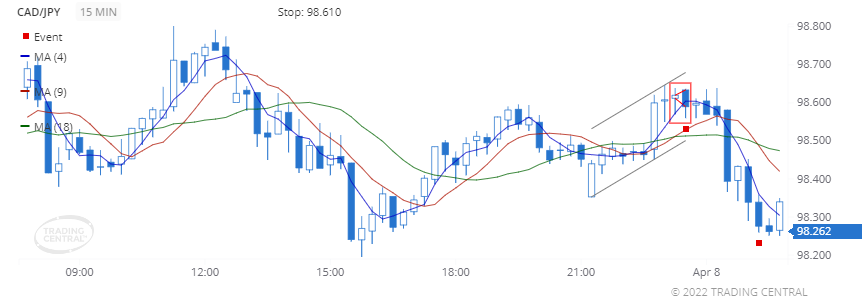
Image Features: forms “Engulfing Line (Bearish)” pattern
Target
Opportunity recognized 2022 Apr 07 for the period of up to 12 hours
-0.328 (32.8 pips) price change since the Technical Event at 98.590
Technical Analysis
We found a pattern called Engulfing Line (Bearish) on 2022 Apr 07 at 23:30 GMT on a 15 minute chart suggesting the outlook is bearish for up to 12 hours.
On 2022 Apr 08 at 01:15 GMT, the 4-bar Moving Average crossed below the 9-bar MA which crossed below the 18-bar MA, signaling a new downtrend has been established.
2. Daily Analyst’s View
EUR/USD
may fall 23 – 43 pips
Pivot
1.0895
Our preference
Short positions below 1.0895 with targets at 1.0840 & 1.0820 in extension.
Alternative scenario
Above 1.0895 look for further upside with 1.0915 & 1.0935 as targets.
Comment
The RSI is bearish and calls for further decline.
GBP/USD
may fall 19 – 34 pips
Pivot
1.3095
Our preference
Short positions below 1.3095 with targets at 1.3050 & 1.3035 in extension.
Alternative scenario
Above 1.3095 look for further upside with 1.3110 & 1.3125 as targets.
Comment
As long as the resistance at 1.3095 is not surpassed, the risk of the break below 1.3050 remains high.
USD/CAD
may rise 25 – 45 pips

Pivot
1.2560
Our preference
Long positions above 1.2560 with targets at 1.2610 & 1.2630 in extension.
Alternative scenario
Below 1.2560 look for further downside with 1.2540 & 1.2520 as targets.
Comment
The RSI calls for a bounce.
Gold
may rise to 1938.00 – 1944.00
Pivot
1924.00
Our preference
Long positions above 1924.00 with targets at 1938.00 & 1944.00 in extension.
Alternative scenario
Below 1924.00 look for further downside with 1915.00 & 1907.00 as targets.
Comment
The RSI is mixed with a bullish bias.
Crude Oil (WTI)
may fall to 93.80 – 95.40
Pivot
98.80
Our preference
Short positions below 98.80 with targets at 95.40 & 93.80 in extension.
Alternative scenario
Above 98.80 look for further upside with 100.20 & 101.90 as targets.
Comment
As long as 98.80 is resistance, expect a return to 95.40.
S&P 500 (CME)
may fall to 4415.00 – 4439.00
Pivot
4480.00
Our preference
Long positions above 4480.00 with targets at 4536.00 & 4555.00 in extension.
Alternative scenario
Below 4480.00 look for further downside with 4444.00 & 4415.00 as targets.
Comment
The RSI calls for a bounce.
Nasdaq 100 (CME)
may rise to 14780.00 – 14930.00
Pivot
14440.00
Our preference
Long positions above 14440.00 with targets at 14780.00 & 14930.00 in extension.
Alternative scenario
Below 14440.00 look for further downside with 14300.00 & 14180.00 as targets.
Comment
The RSI calls for a bounce.
Hang Seng (HKFE)
may fall to 21290.00 – 21550.00
Pivot
21950.00
Our preference
Short positions below 21950.00 with targets at 21550.00 & 21290.00 in extension.
Alternative scenario
Above 21950.00 look for further upside with 22210.00 & 22400.00 as targets.
Comment
Even though a continuation of the technical rebound cannot be ruled out, its extent should be limited.
Disclaimer:
This report is prepared and published by Trading Central for all clients of Doo Prime. As a third-party indicator tool, Trading Central is only for your strategic reference during the investment process and does not constitute advice or a recommendation by Doo Prime or Trading Central. Neither Doo Prime nor Trading Central are responsible to bear the relevant legal liabilities for the investment risks arising from your use of this report to make buying and selling decisions.