1. Daily technical analysis of selected currency pairs
GBP/JPY Bearish
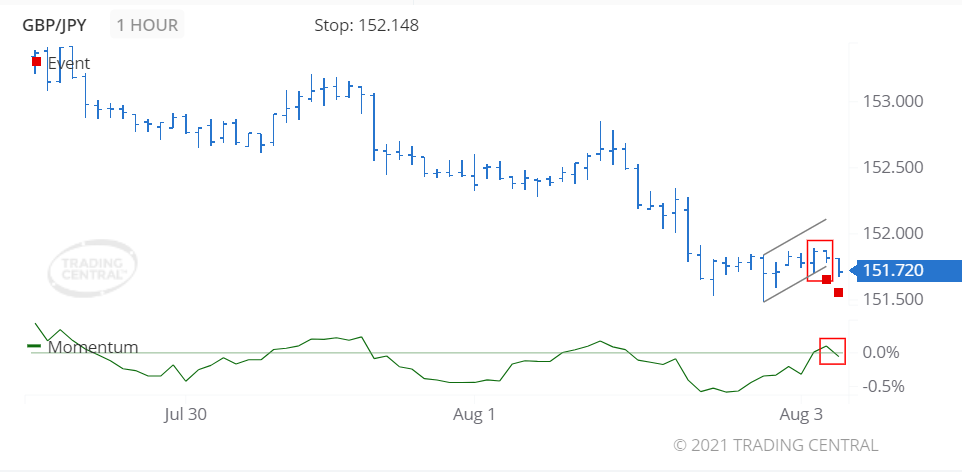
Image Features: forms “Inside Bar (Bearish)” pattern
Target
Opportunity recognized 2021 Aug 03 for the period of up to 12 hours
-0.099 (9.9 pips) price change since the Technical Event at 151.819
Technical Analysis
We found a pattern called Inside Bar (Bearish) on 2021 Aug 03 at 02:00 GMT on a 1 hour chart suggesting the outlook is bearish for up to 12 hours.
The Momentum oscillator crossed below 0 on 2021 Aug 03 at 03:00 GMT, thereby signaling a new accelerating downtrend.
USD/AUD Bullish
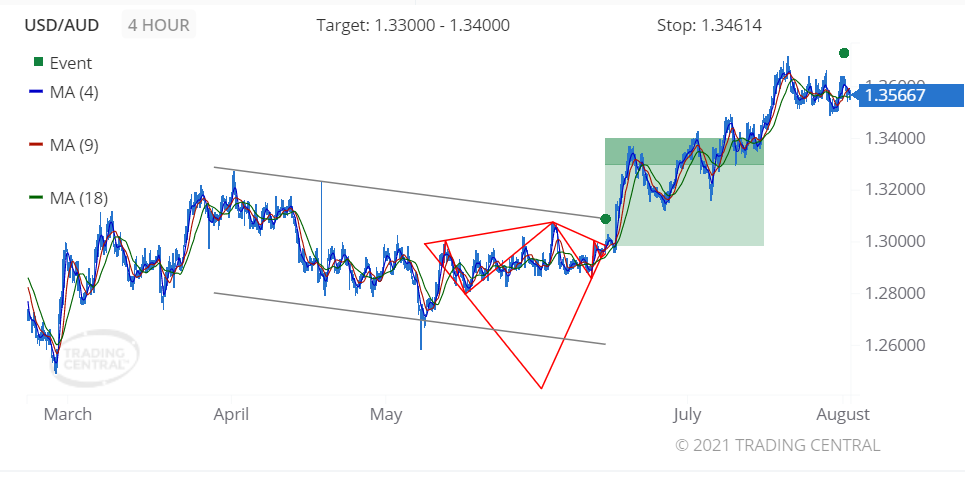
Image Features: forms “Diamond Bottom (Bullish)” pattern
Target
Opportunity recognized 2021 Jun 15 for the period of up to 2 weeks
+0.05810 (580 pips) price change since the Technical Event at 1.29857
Technical Analysis
We found a pattern called Diamond Bottom on 2021 Jun 15 at 09:00 GMT on a 4 hour chart, providing a target price for up to 2 weeks in the range of 1.33000 to 1.34000.
On 2021 Aug 02 at 05:00 GMT, the 4-bar Moving Average crossed above the 9-bar MA which crossed above the 18-bar MA, signaling a new uptrend has been established.
2. Daily Analyst’s View
EUR/USD
may rise 23 – 38 pips
Pivot
1.1850
Our preference
Long positions above 1.1850 with targets at 1.1895 & 1.1910 in extension.
Alternative scenario
Below 1.1850 look for further downside with 1.1835 & 1.1820 as targets.
Comment
Even though a continuation of the consolidation cannot be ruled out, its extent should be limited.
GBP/USD
may fall 28 – 48 pips
Pivot
1.3910
Our preference
Short positions below 1.3910 with targets at 1.3860 & 1.3840 in extension.
Alternative scenario
Above 1.3910 look for further upside with 1.3930 & 1.3950 as targets.
Comment
The RSI calls for a new downleg.
USD/CAD
may rise 32 – 52 pips
Pivot
1.2470
Our preference
Long positions above 1.2470 with targets at 1.2530 & 1.2550 in extension.
Alternative scenario
Below 1.2470 look for further downside with 1.2450 & 1.2430 as targets.
Comment
The RSI advocates for further upside.
Gold
may rise to 1820.00 – 1826.00
Pivot
1805.00
Our preference
Long positions above 1805.00 with targets at 1820.00 & 1826.00 in extension.
Alternative scenario
Below 1805.00 look for further downside with 1800.00 & 1792.00 as targets.
Comment
The RSI is mixed with a bullish bias.
Crude Oil (WTI)
may rise to 72.00 – 72.40
Pivot
71.05
Our preference
Long positions above 71.05 with targets at 72.00 & 72.40 in extension.
Alternative scenario
Below 71.05 look for further downside with 70.55 & 70.00 as targets.
Comment
The RSI has broken up its 30 level.
S&P 500 (CME)
may fall to 4364.00 – 4372.00
Pivot
4395.00
Our preference
Short positions below 4395.00 with targets at 4372.00 & 4364.00 in extension.
Alternative scenario
Above 4395.00 look for further upside with 4407.00 & 4419.00 as targets.
Comment
As long as the resistance at 4395.00 is not surpassed, the risk of the break below 4372.00 remains high.
Nasdaq 100 (CME)
may fall to 14810.00 – 14870.00
Pivot
15050.00
Our preference
Short positions below 15050.00 with targets at 14870.00 & 14810.00 in extension.
Alternative scenario
Above 15050.00 look for further upside with 15150.00 & 15205.00 as targets.
Comment
The RSI shows downside momentum.
Hang Seng (HKFE)
may rise to 26615.00 – 26800.00
Pivot
25680.00
Our preference
Long positions above 25680.00 with targets at 26615.00 & 26800.00 in extension.
Alternative scenario
Below 25680.00 look for further downside with 25250.00 & 24800.00 as targets.
Comment
Technically the RSI is above its neutrality area at 50.
Disclaimer:
This report is prepared and published by Trading Central for all clients of Doo Prime. As a third-party indicator tool, Trading Central is only for your strategic reference during the investment process and does not constitute advice or a recommendation by Doo Prime or Trading Central. Neither Doo Prime nor Trading Central are responsible to bear the relevant legal liabilities for the investment risks arising from your use of this report to make buying and selling decisions.