

1. Daily technical analysis of selected currency pairs
AUD/JPY Bullish
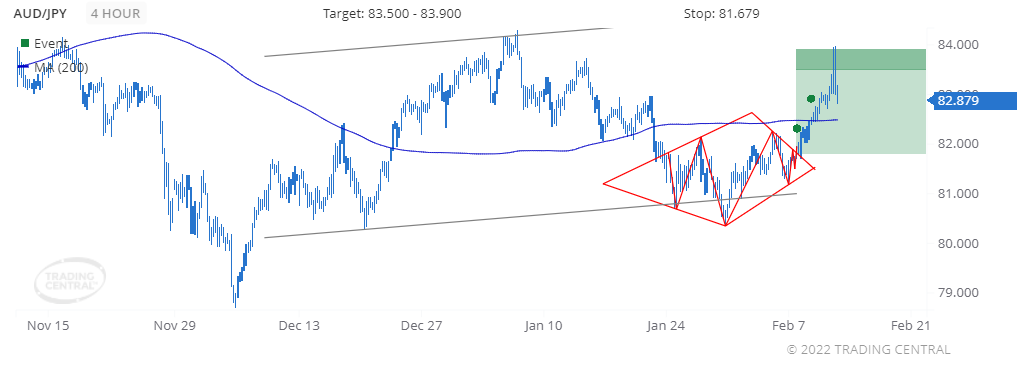
Image Features: forms “Continuation Diamond (Bullish)” pattern
Target
Opportunity recognized 2022 Feb 07 for the period of up to 2 weeks
+1.061 (106.1 pips) price change since the Technical Event at 81.818
Technical Analysis
We found a pattern called Continuation Diamond (Bullish) on 2022 Feb 07 at 17:00 GMT on a 4 hour chart, providing a target price for up to 2 weeks in the range of 83.500 to 83.900.
The price crossed above its moving average on 2022 Feb 08 at 21:00 GMT signaling a new uptrend has been established.
CAD/JPY Bullish
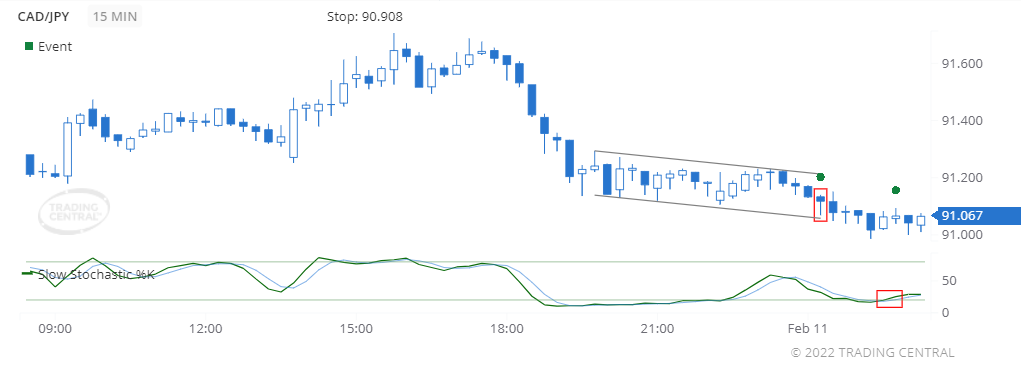
Image Features: forms “Hammer (Bullish)” pattern
Target
Opportunity recognized 2022 Feb 11 for the period of up to 12 hours
-0.051 (5.1 pips) price change since the Technical Event at 91.118
Technical Analysis
We found a pattern called Hammer on 2022 Feb 11 at 00:15 GMT on a 15 minute chart suggesting the outlook is bullish for up to 12 hours.
A bullish event triggered for Slow Stochastics on 2022 Feb 11 at 01:45 GMT when the %K line crossed above the %D line. The close prices are trading closer to the upper end of the recent high-low price range, which is associated with price increases.
2. Daily Analyst’s View
EUR/USD
may fall 36 – 56 pips
Pivot
1.1450
Our preference
Short positions below 1.1450 with targets at 1.1380 & 1.1360 in extension.
Alternative scenario
Above 1.1450 look for further upside with 1.1470 & 1.1490 as targets.
Comment
The RSI calls for a new downleg.
GBP/USD
may fall 33 – 63 pips
Pivot
1.3590
Our preference
Short positions below 1.3590 with targets at 1.3520 & 1.3490 in extension.
Alternative scenario
Above 1.3590 look for further upside with 1.3615 & 1.3640 as targets.
Comment
The RSI advocates for further downside.
USD/CAD
may rise 30 – 60 pips
Pivot
1.2690
Our preference
Long positions above 1.2690 with targets at 1.2760 & 1.2790 in extension.
Alternative scenario
Below 1.2690 look for further downside with 1.2665 & 1.2640 as targets.
Comment
The RSI is bullish and calls for further advance.
Gold
may fall to 1814.00 – 1821.00
Pivot
1835.00
Our preference
Short positions below 1835.00 with targets at 1821.00 & 1814.00 in extension.
Alternative scenario
Above 1835.00 look for further upside with 1842.00 & 1850.00 as targets.
Comment
As long as the resistance at 1835.00 is not surpassed, the risk of the break below 1821.00 remains high.
Crude Oil (WTI)
may fall to 88.90 – 89.50
Pivot
90.55
Our preference
Short positions below 90.55 with targets at 89.50 & 88.90 in extension.
Alternative scenario
Above 90.55 look for further upside with 91.15 & 91.70 as targets.
Comment
As long as 90.55 is resistance, look for choppy price action with a bearish bias.
S&P 500 (CME)
may fall to 4395.00 – 4438.00
Pivot
4525.00
Our preference
Short positions below 4525.00 with targets at 4438.00 & 4395.00 in extension.
Alternative scenario
Above 4525.00 look for further upside with 4585.00 & 4630.00 as targets.
Comment
The RSI has broken down its 30 level.
Nasdaq 100 (CME)
may fall to 14415.00 – 14500.00
Pivot
14820.00
Our preference
Short positions below 14820.00 with targets at 14500.00 & 14415.00 in extension.
Alternative scenario
Above 14820.00 look for further upside with 14960.00 & 15070.00 as targets.
Comment
The RSI advocates for further decline.
Hang Seng (HKFE)
may rise to 25110.00 – 25380.00
Pivot
24650.00
Our preference
Long positions above 24650.00 with targets at 25110.00 & 25380.00 in extension.
Alternative scenario
Below 24650.00 look for further downside with 24380.00 & 24150.00 as targets.
Comment
The RSI is mixed.
Disclaimer:
This report is prepared and published by Trading Central for all clients of Doo Prime. As a third-party indicator tool, Trading Central is only for your strategic reference during the investment process and does not constitute advice or a recommendation by Doo Prime or Trading Central. Neither Doo Prime nor Trading Central are responsible to bear the relevant legal liabilities for the investment risks arising from your use of this report to make buying and selling decisions.