

1. Daily technical analysis of selected currency pairs
AUD/JPY Bullish
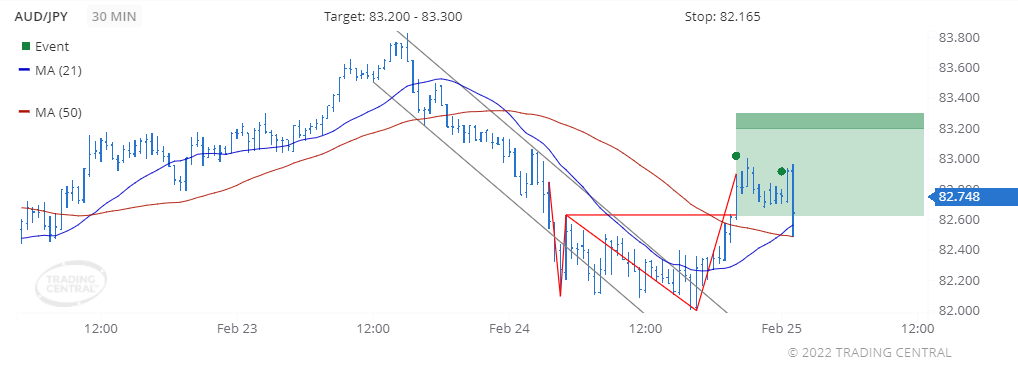
Image Features: forms “Double Bottom (Bullish)” pattern
Target
Opportunity recognized 2022 Feb 24 for the period of up to 48 hours
+0.117 (11.7 pips) price change since the Technical Event at 82.631
Technical Analysis
We found a pattern called Double Bottom on 2022 Feb 24 at 20:00 GMT on a 30 minute chart, providing a target price for up to 48 hours in the range of 83.200 to 83.300.
The faster moving average crossed above the slower moving average on 2022 Feb 25 at 00:00 GMT, signaling a new uptrend has been established.
CAD/JPY Bearish
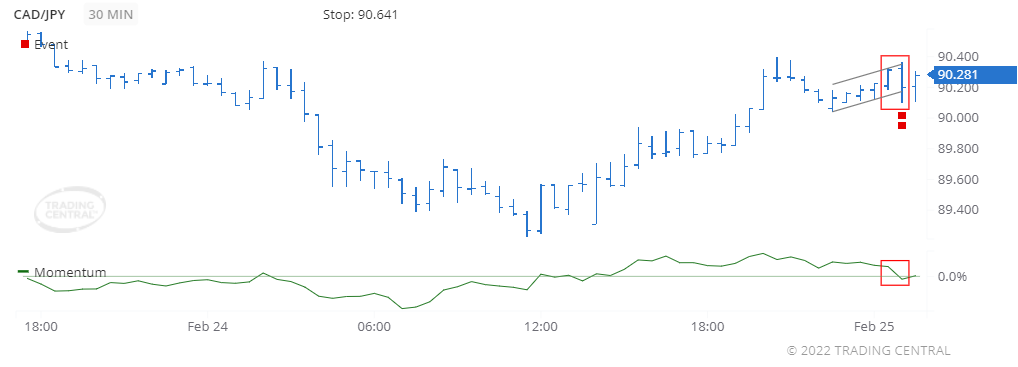
Image Features: forms “Two Bar Reversal (Bearish)” pattern
Target
Opportunity recognized 2022 Feb 25 for the period of up to 12 hours
+0.084 (8.4 pips) price change since the Technical Event at 90.197
Technical Analysis
We found a pattern called Two Bar Reversal (Bearish) on 2022 Feb 25 at 01:00 GMT on a 30 minute chart suggesting the outlook is bearish for up to 12 hours.
The Momentum oscillator crossed below 0 on 2022 Feb 25 at 01:00 GMT, thereby signaling a new accelerating downtrend.
2. Daily Analyst’s View
EUR/USD
may rise 43 – 68 pips
Pivot
1.1150
Our preference
Long positions above 1.1150 with targets at 1.1235 & 1.1260 in extension.
Alternative scenario
Below 1.1150 look for further downside with 1.1130 & 1.1105 as targets.
Comment
The RSI shows upside momentum.
GBP/USD
may rise 31 – 66 pips
Pivot
1.3330
Our preference
Long positions above 1.3330 with targets at 1.3405 & 1.3440 in extension.
Alternative scenario
Below 1.3330 look for further downside with 1.3300 & 1.3270 as targets.
Comment
Even though a continuation of the consolidation cannot be ruled out, its extent should be limited.
USD/CAD
may fall 33 – 53 pips
Pivot
1.2835
Our preference
Short positions below 1.2835 with targets at 1.2775 & 1.2755 in extension.
Alternative scenario
Above 1.2835 look for further upside with 1.2855 & 1.2875 as targets.
Comment
The RSI calls for a drop.
Gold
may fall to 1878.00 – 1892.00
Pivot
1920.00
Our preference
Short positions below 1920.00 with targets at 1892.00 & 1878.00 in extension.
Alternative scenario
Above 1920.00 look for further upside with 1940.00 & 1956.00 as targets.
Comment
Technically the RSI is below its neutrality area at 50.
Crude Oil (WTI)
may fall to 91.45 – 92.60
Pivot
95.65
Our preference
Short positions below 95.65 with targets at 92.60 & 91.45 in extension.
Alternative scenario
Above 95.65 look for further upside with 97.00 & 98.20 as targets.
Comment
The index currently faces a challenging resistance area at 95.65.
S&P 500 (CME)
may rise to 4305.00 – 4360.00
Pivot
4190.00
Our preference
Long positions above 4190.00 with targets at 4305.00 & 4360.00 in extension.
Alternative scenario
Below 4190.00 look for further downside with 4150.00 & 4100.00 as targets.
Comment
The RSI shows upside momentum.
Nasdaq 100 (CME)
may rise to 14130.00 – 14300.00
Pivot
13540.00
Our preference
Long positions above 13540.00 with targets at 14130.00 & 14300.00 in extension.
Alternative scenario
Below 13540.00 look for further downside with 13250.00 & 13025.00 as targets.
Comment
The RSI shows upside momentum.
Hang Seng (HKFE)
may fall to 21970.00 – 22400.00
Pivot
22900.00
Our preference
Short positions below 22900.00 with targets at 22400.00 & 21970.00 in extension.
Alternative scenario
Above 22900.00 look for further upside with 23260.00 & 23625.00 as targets.
Comment
As long as the resistance at 22900.00 is not surpassed, the risk of the break below 22400.00 remains high.
Disclaimer:
This report is prepared and published by Trading Central for all clients of Doo Prime. As a third-party indicator tool, Trading Central is only for your strategic reference during the investment process and does not constitute advice or a recommendation by Doo Prime or Trading Central. Neither Doo Prime nor Trading Central are responsible to bear the relevant legal liabilities for the investment risks arising from your use of this report to make buying and selling decisions.