1. Daily technical analysis of selected currency pairs
EUR/JPY Bullish
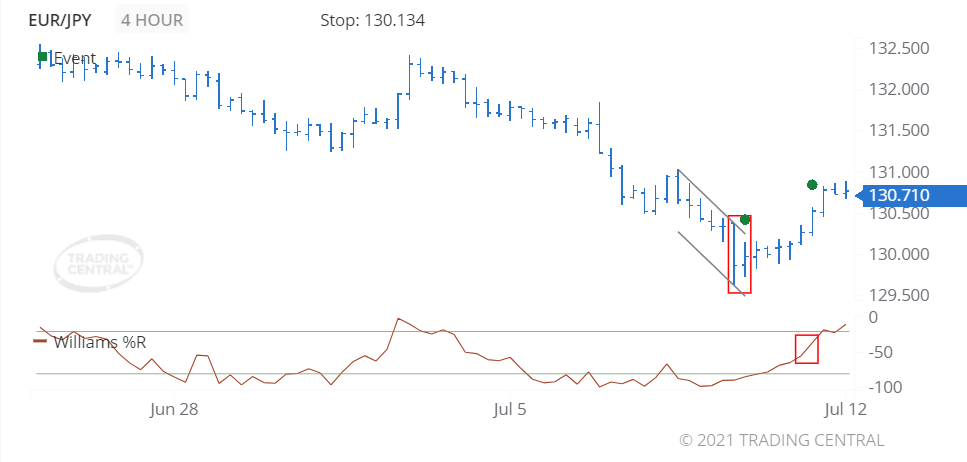
Image Features: forms “Inside Bar (Bullish)” pattern
Target
Opportunity recognized 2021 Jul 08 for the period of up to 48 hours
+0.733 (73.3 pips) price change since the Technical Event at 129.977
Technical Analysis
We found a pattern called Inside Bar (Bullish) on 2021 Jul 08 at 13:00 GMT on a 4 hour chart suggesting the outlook is bullish for up to 48 hours.
The Williams %R indicator triggered a bullish signal on 2021 Jul 09 at 13:00 GMT, having risen up out of oversold (-80 level) and continued on to cross above the -50 level.
GBP/HKD Bullish
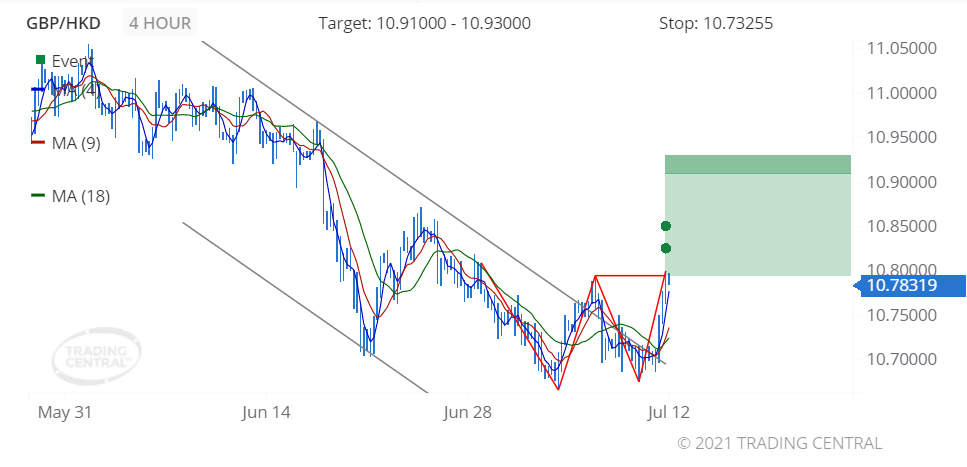
Image Features: forms “Double Bottom (Bullish)” pattern
Target
Opportunity recognized 2021 Jul 09 for the period of up to 2 weeks
-0.01163 (116.3 pips) price change since the Technical Event at 10.79482
Technical Analysis
We found a pattern called Double Bottom on 2021 Jul 09 at 21:00 GMT on a 4 hour chart, providing a target price for up to 2 weeks in the range of 10.91000 to 10.93000.
On 2021 Jul 09 at 21:00 GMT, the 4-bar Moving Average crossed above the 9-bar MA which crossed above the 18-bar MA, signaling a new uptrend has been established.
2. Daily Analyst’s View
EUR/USD
may rise 26 – 41 pips
Pivot
1.1855
Our preference
Long positions above 1.1855 with targets at 1.1895 & 1.1910 in extension.
Alternative scenario
Below 1.1855 look for further downside with 1.1840 & 1.1825 as targets.
Comment
The RSI is mixed with a bullish bias.
GBP/USD
may rise 23 – 53 pips
Pivot
1.3850
Our preference
Long positions above 1.3850 with targets at 1.3910 & 1.3940 in extension.
Alternative scenario
Below 1.3850 look for further downside with 1.3820 & 1.3790 as targets.
Comment
The RSI calls for a new upleg.
USD/CAD
may fall 49 – 69 pips
Pivot
1.2500
Our preference
Short positions below 1.2500 with targets at 1.2420 & 1.2400 in extension.
Alternative scenario
Above 1.2500 look for further upside with 1.2530 & 1.2555 as targets.
Comment
The upward potential is likely to be limited by the resistance at 1.2500.
Gold
may rise to 1812.00 – 1818.00
Pivot
1800.00
Our preference
Long positions above 1800.00 with targets at 1812.00 & 1818.00 in extension.
Alternative scenario
Below 1800.00 look for further downside with 1795.00 & 1789.00 as targets.
Comment
Even though a continuation of the consolidation cannot be ruled out, its extent should be limited.
Crude Oil (WTI)
may rise to 75.60 – 76.30
Pivot
73.30
Our preference
Long positions above 73.30 with targets at 75.60 & 76.30 in extension.
Alternative scenario
Below 73.30 look for further downside with 72.30 & 71.60 as targets.
Comment
The RSI advocates for further upside.
S&P 500 (CME)
may rise to 4368.00 – 4375.00
Pivot
4350.00
Our preference
Long positions above 4350.00 with targets at 4368.00 & 4375.00 in extension.
Alternative scenario
Below 4350.00 look for further downside with 4340.00 & 4330.00 as targets.
Comment
The break above 4350.00 is a positive signal that has opened a path to 4368.00.
Nasdaq 100 (CME)
may rise to 14845.00 – 14890.00
Pivot
14775.00
Our preference
Long positions above 14775.00 with targets at 14845.00 & 14890.00 in extension.
Alternative scenario
Below 14775.00 look for further downside with 14735.00 & 14690.00 as targets.
Comment
The break above 14775.00 is a positive signal that has opened a path to 14845.00.
Hang Seng (HKFE)
may rise to 27890.00 – 28020.00
Pivot
27450.00
Our preference
Long positions above 27450.00 with targets at 27890.00 & 28020.00 in extension.
Alternative scenario
Below 27450.00 look for further downside with 27240.00 & 27050.00 as targets.
Comment
The RSI shows upside momentum.
Disclaimer:
This report is prepared and published by Trading Central for all clients of Doo Prime. As a third-party indicator tool, Trading Central is only for your strategic reference during the investment process and does not constitute advice or a recommendation by Doo Prime or Trading Central. Neither Doo Prime nor Trading Central are responsible to bear the relevant legal liabilities for the investment risks arising from your use of this report to make buying and selling decisions.