1. Daily technical analysis of selected currency pairs
AUD/JPY Bullish
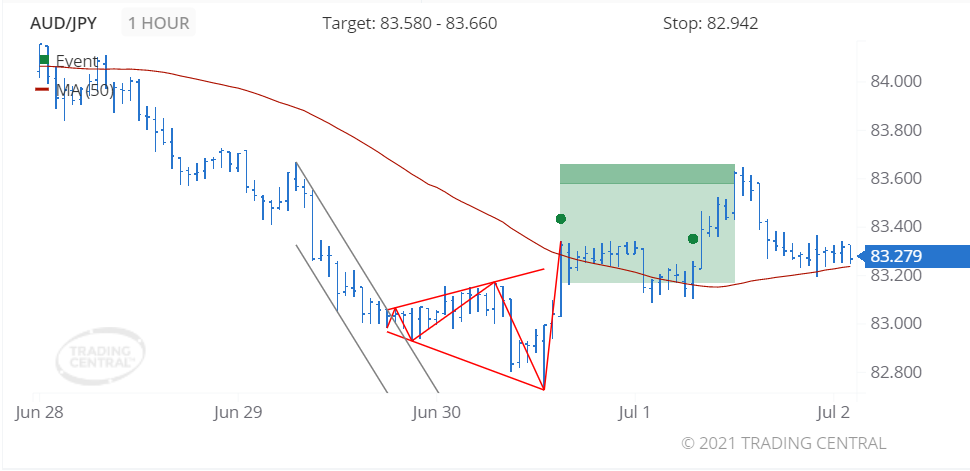
Image Features: forms “Megaphone Bottom (Bullish)” pattern
Target
Opportunity recognized 2021 Jun 30 for the period of up to 48 hours
+0.105 (10.5 pips) price change since the Technical Event at 83.174
Technical Analysis
We found a pattern called Megaphone Bottom on 2021 Jun 30 at 15:00 GMT on a 1 hour chart, providing a target price for up to 48 hours in the range of 83.580 to 83.660.
The price crossed above its moving average on 2021 Jul 01 at 07:00 GMT signaling a new uptrend has been established.
USD/CAD Bearish
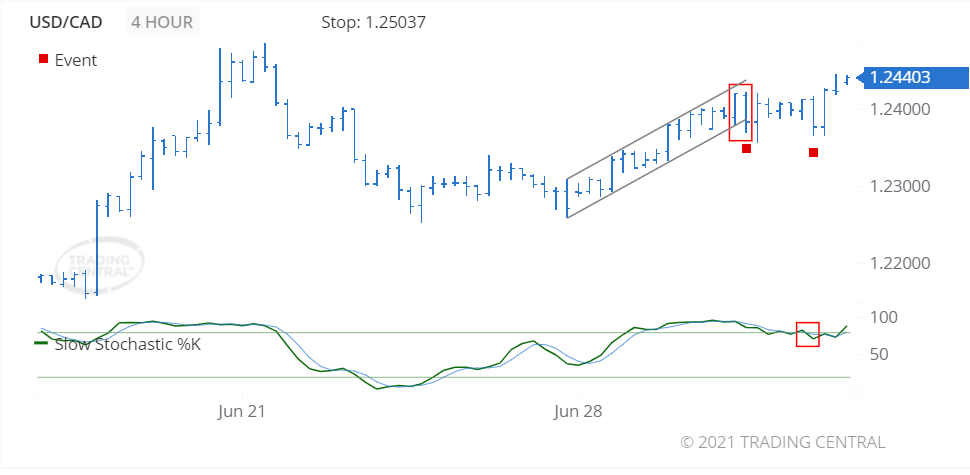
Image Features: forms “Two Bar Reversal (Bearish)” pattern
Target
Opportunity recognized 2021 Jun 30 for the period of up to 48 hours
+0.00568 (56.8 pips) price change since the Technical Event at 1.23835
Technical Analysis
We found a pattern called Two Bar Reversal (Bearish) on 2021 Jun 30 at 13:00 GMT on a 4 hour chart suggesting the outlook is bearish for up to 48 hours.
A bearish event triggered for Slow Stochastics on 2021 Jul 01 at 13:00 GMT when the %K line crossed below the %D line. The close prices are trading closer to the lower end of the recent high-low price range, which is associated with price decreases.
2. Daily Analyst’s View
EUR/USD
may fall 23 – 38 pips
Pivot
1.1890
Our preference
Short positions below 1.1890 with targets at 1.1840 & 1.1810 in extension.
Alternative scenario
Above 1.1890 look for further upside with 1.1910 & 1.1930 as targets.
Comment
The RSI is bearish and calls for further downside.
GBP/USD
may fall 29 – 59 pips
Pivot
1.3800
Our preference
Short positions below 1.3800 with targets at 1.3730 & 1.3700 in extension.
Alternative scenario
Above 1.3800 look for further upside with 1.3820 & 1.3840 as targets.
Comment
The RSI is bearish and calls for further downside.
USD/CAD
may rise 25 – 50 pips
Pivot
1.2400
Our preference
Long positions above 1.2400 with targets at 1.2460 & 1.2485 in extension.
Alternative scenario
Below 1.2400 look for further downside with 1.2380 & 1.2360 as targets.
Comment
The RSI is bullish and calls for further advance.
Gold
may rise to 1783.00 – 1790.00
Pivot
1765.00
Our preference
Long positions above 1765.00 with targets at 1783.00 & 1790.00 in extension.
Alternative scenario
Below 1765.00 look for further downside with 1759.00 & 1750.00 as targets.
Comment
The RSI is mixed with a bullish bias.
Crude Oil (WTI)
may rise to 75.70 – 76.20
Pivot
74.50
Our preference
Long positions above 74.50 with targets at 75.70 & 76.20 in extension.
Alternative scenario
Below 74.50 look for further downside with 74.00 & 73.40 as targets.
Comment
Technically the RSI is above its neutrality area at 50.
S&P 500 (CME)
may rise to 4324.00 – 4335.00
Pivot
4298.00
Our preference
Long positions above 4298.00 with targets at 4324.00 & 4335.00 in extension.
Alternative scenario
Below 4298.00 look for further downside with 4285.00 & 4269.00 as targets.
Comment
The RSI is bullish and calls for further advance.
Nasdaq 100 (CME)
may rise to 14575.00 – 14605.00
Pivot
14490.00
Our preference
Long positions above 14490.00 with targets at 14575.00 & 14605.00 in extension.
Alternative scenario
Below 14490.00 look for further downside with 14450.00 & 14400.00 as targets.
Comment
The RSI is mixed to bullish.
Hang Seng (HKFE)
may fall to 28420.00 – 28540.00
Pivot
28780.00
Our preference
Short positions below 28780.00 with targets at 28540.00 & 28420.00 in extension.
Alternative scenario
Above 28780.00 look for further upside with 28900.00 & 29025.00 as targets.
Comment
The RSI calls for a drop.
Disclaimer:
This report is prepared and published by Trading Central for all clients of Doo Prime. As a third-party indicator tool, Trading Central is only for your strategic reference during the investment process and does not constitute advice or a recommendation by Doo Prime or Trading Central. Neither Doo Prime nor Trading Central are responsible to bear the relevant legal liabilities for the investment risks arising from your use of this report to make buying and selling decisions.