1. Daily technical analysis of selected currency pairs
AUD/JPY Bullish
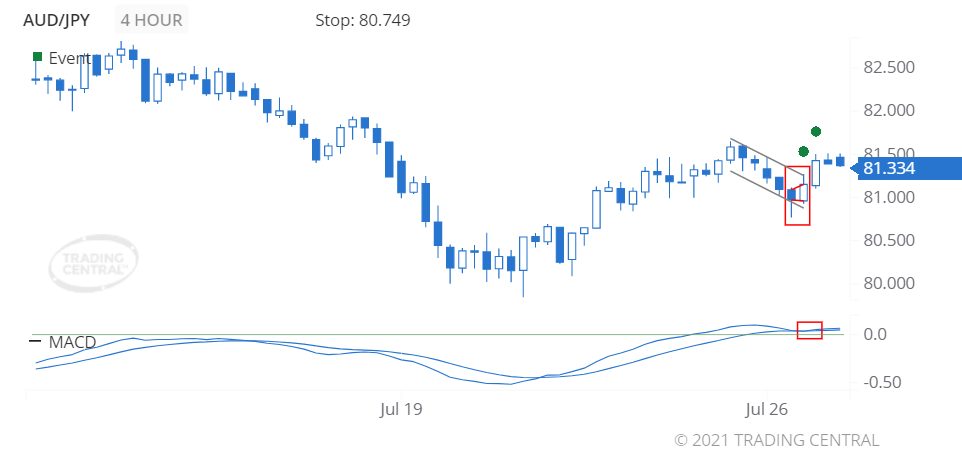
Image Features: forms “Engulfing Line (Bullish)” pattern
Target
Opportunity recognized 2021 Jul 26 for the period of up to 48 hours
+0.183 (18.3 pips) price change since the Technical Event at 81.151
Technical Analysis
We found a pattern called Engulfing Line (Bullish) on 2021 Jul 26 at 13:00 GMT on a 4 hour chart suggesting the outlook is bullish for up to 48 hours.
The MACD generated a bullish signal on 2021 Jul 26 at 17:00 GMT.
GBP/CAD Bullish
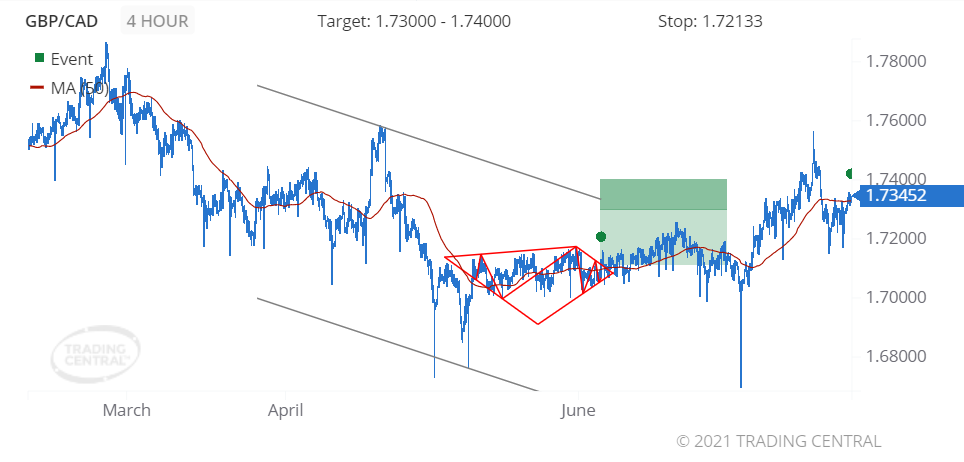
Image Features: forms “Diamond Bottom (Bullish)” pattern
Target
Opportunity recognized 2021 Jun 04 for the period of up to 2 weeks
+0.02324 (232.4 pips) price change since the Technical Event at 1.71128
Technical Analysis
We found a pattern called Diamond Bottom on 2021 Jun 04 at 09:00 GMT on a 4 hour chart, providing a target price for up to 2 weeks in the range of 1.73000 to 1.74000.
The price crossed above its moving average on 2021 Jul 27 at 01:00 GMT signaling a new uptrend has been established.
2. Daily Analyst’s View
EUR/USD
may rise 11 – 26 pips
Pivot
1.1790
Our preference
Long positions above 1.1790 with targets at 1.1815 & 1.1830 in extension.
Alternative scenario
Below 1.1790 look for further downside with 1.1775 & 1.1760 as targets.
Comment
Even though a continuation of the consolidation cannot be ruled out, its extent should be limited.
GBP/USD
may rise 14 – 39 pips
Pivot
1.3800
Our preference
Long positions above 1.3800 with targets at 1.3835 & 1.3860 in extension.
Alternative scenario
Below 1.3800 look for further downside with 1.3775 & 1.3745 as targets.
Comment
Technically the RSI is above its neutrality area at 50.
USD/CAD
may fall 13 – 28 pips
Pivot
1.2560
Our preference
Short positions below 1.2560 with targets at 1.2535 & 1.2520 in extension.
Alternative scenario
Above 1.2560 look for further upside with 1.2575 & 1.2590 as targets.
Comment
A break below 1.2535 would trigger a drop towards 1.2520.
Gold
may fall to 1784.00 – 1789.00
Pivot
1805.00
Our preference
Short positions below 1805.00 with targets at 1789.00 & 1784.00 in extension.
Alternative scenario
Above 1805.00 look for further upside with 1811.00 & 1819.00 as targets.
Comment
As long as 1805.00 is resistance, look for choppy price action with a bearish bias.
Crude Oil (WTI)
may rise to 73.00 – 73.60
Pivot
71.40
Our preference
Long positions above 71.40 with targets at 73.00 & 73.60 in extension.
Alternative scenario
Below 71.40 look for further downside with 70.55 & 70.10 as targets.
Comment
The RSI calls for a new upleg.
S&P 500 (CME)
may rise to 4437.00 – 4450.00
Pivot
4397.00
Our preference
Long positions above 4397.00 with targets at 4437.00 & 4450.00 in extension.
Alternative scenario
Below 4397.00 look for further downside with 4375.00 & 4356.00 as targets.
Comment
The RSI shows upside momentum.
Nasdaq 100 (CME)
may rise to 15200.00 – 15245.00
Pivot
15040.00
Our preference
Long positions above 15040.00 with targets at 15200.00 & 15245.00 in extension.
Alternative scenario
Below 15040.00 look for further downside with 14995.00 & 14935.00 as targets.
Comment
The RSI is mixed.
Hang Seng (HKFE)
may fall to 25500.00 – 25730.00
Pivot
26365.00
Our preference
Short positions below 26365.00 with targets at 25730.00 & 25500.00 in extension.
Alternative scenario
Above 26365.00 look for further upside with 26615.00 & 26905.00 as targets.
Comment
As long as the resistance at 26365.00 is not surpassed, the risk of the break below 25730.00 remains high.
Disclaimer:
This report is prepared and published by Trading Central for all clients of Doo Prime. As a third-party indicator tool, Trading Central is only for your strategic reference during the investment process and does not constitute advice or a recommendation by Doo Prime or Trading Central. Neither Doo Prime nor Trading Central are responsible to bear the relevant legal liabilities for the investment risks arising from your use of this report to make buying and selling decisions.