1. Daily technical analysis of selected currency pairs
USD/JPY Bullish

Image Features: forms “Outside Bar (Bullish)” pattern
Target
Opportunity recognized 2021 Jul 08 for the period of up to 12 hours
-0.004 (0.4 pips) price change since the Technical Event at 110.572
Technical Analysis
We found a pattern called Outside Bar (Bullish) on 2021 Jul 08 at 02:30 GMT on a 30 minute chart suggesting the outlook is bullish for up to 12 hours.
A bullish event triggered for Slow Stochastics on 2021 Jul 08 at 03:00 GMT when the %K line crossed above the %D line. The close prices are trading closer to the upper end of the recent high-low price range, which is associated with price increases.
EUR/HKD Bearish
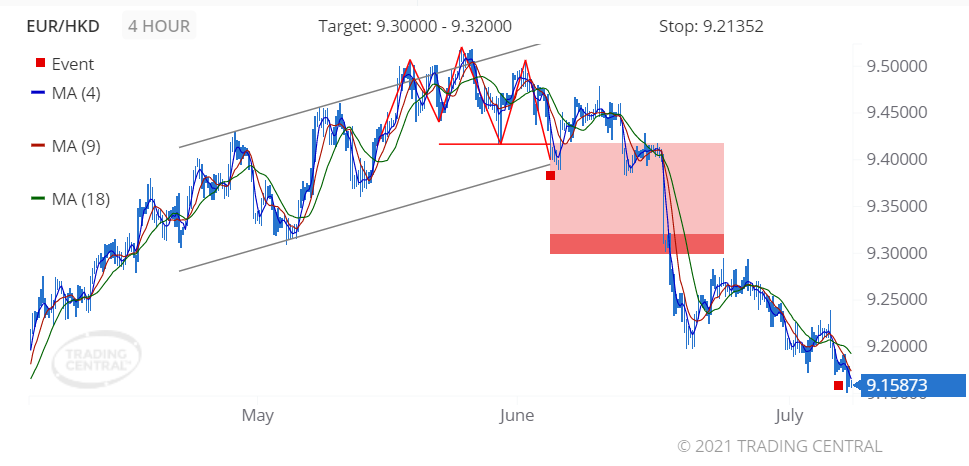
Image Features: forms “Triple Top (Bearish)” pattern
Target
Opportunity recognized 2021 Jun 03 for the period of up to 2 weeks
-0.25796 (2,579.6 pips) price change since the Technical Event at 9.41669
Technical Analysis
We found a pattern called Triple Top on 2021 Jun 03 at 17:00 GMT on a 4 hour chart, providing a target price for up to 2 weeks in the range of 9.30000 to 9.32000.
On 2021 Jul 07 at 01:00 GMT, the 4-bar Moving Average crossed below the 9-bar MA which crossed below the 18-bar MA, signaling a new downtrend has been established.
2. Daily Analyst’s View
EUR/USD
may fall 8 – 28 pips
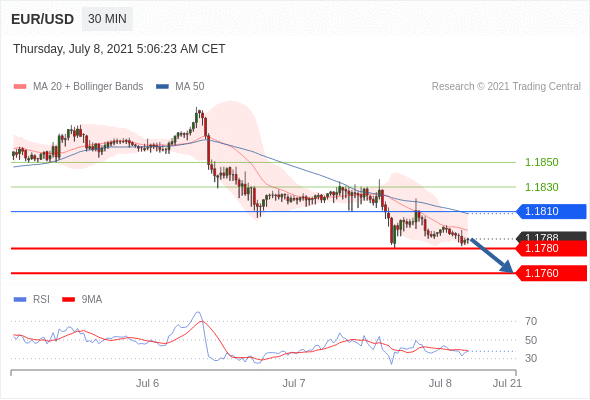
Pivot
1.1810
Our preference
Short positions below 1.1810 with targets at 1.1780 & 1.1760 in extension.
Alternative scenario
Above 1.1810 look for further upside with 1.1830 & 1.1850 as targets.
Comment
A break below 1.1780 would trigger a drop towards 1.1760.
GBP/USD
may fall 25 – 45 pips
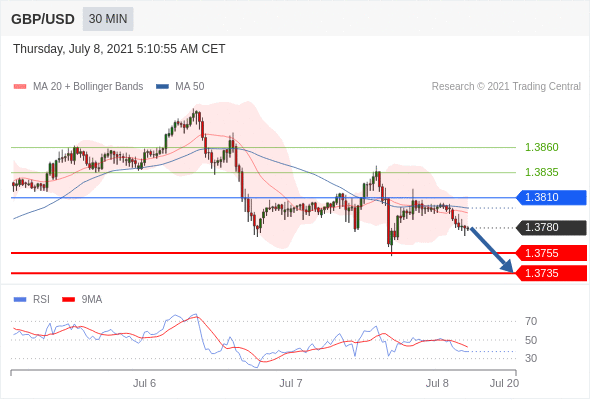
Pivot
1.3810
Our preference
Short positions below 1.3810 with targets at 1.3755 & 1.3735 in extension.
Alternative scenario
Above 1.3810 look for further upside with 1.3835 & 1.3860 as targets.
Comment
The RSI lacks upward momentum.
USD/CAD
may rise 39 – 64 pips
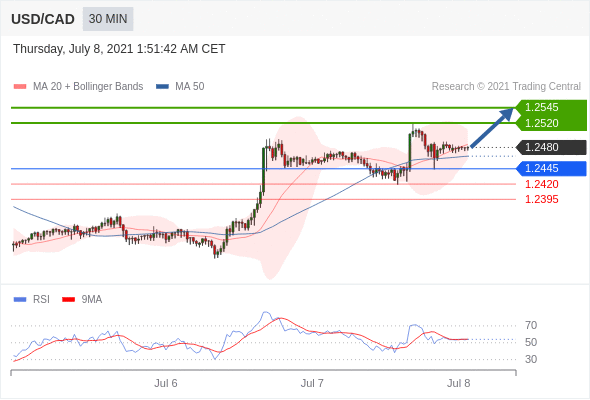
Pivot
1.2445
Our preference
Long positions above 1.2445 with targets at 1.2520 & 1.2545 in extension.
Alternative scenario
Below 1.2445 look for further downside with 1.2420 & 1.2395 as targets.
Comment
The RSI calls for a bounce.
Gold
may fall to 1783.00 – 1789.00
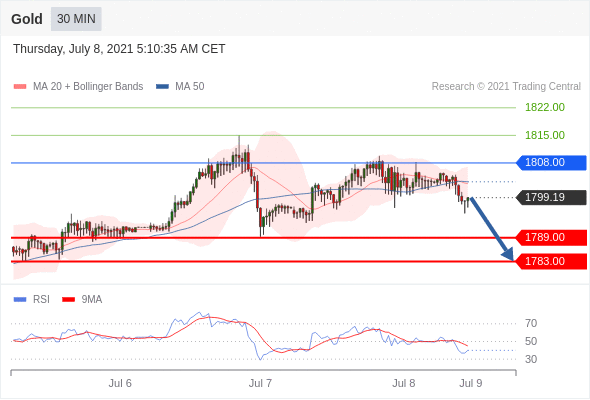
Pivot
1808.00
Our preference
Short positions below 1808.00 with targets at 1789.00 & 1783.00 in extension.
Alternative scenario
Above 1808.00 look for further upside with 1815.00 & 1822.00 as targets.
Comment
As long as 1808.00 is resistance, look for choppy price action with a bearish bias.
Crude Oil (WTI)
may fall to 70.00 – 71.05
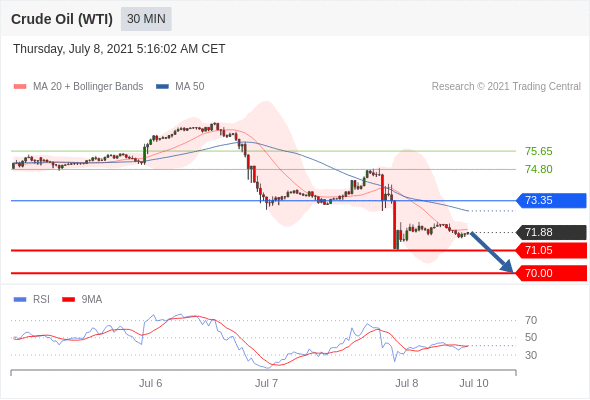
Pivot
73.35
Our preference
Short positions below 73.35 with targets at 71.05 & 70.00 in extension.
Alternative scenario
Above 73.35 look for further upside with 74.80 & 75.65 as targets.
Comment
As long as the resistance at 73.35 is not surpassed, the risk of the break below 71.05 remains high.
S&P 500 (CME)
may rise to 4365.00 – 4375.00
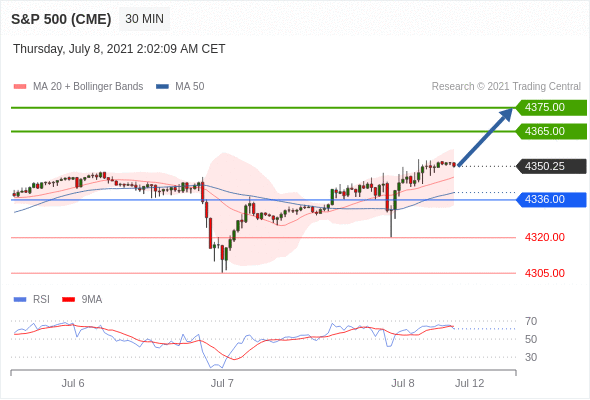
Pivot
4336.00
Our preference
Long positions above 4336.00 with targets at 4365.00 & 4375.00 in extension.
Alternative scenario
Below 4336.00 look for further downside with 4320.00 & 4305.00 as targets.
Comment
The RSI is bullish and calls for further advance.
Nasdaq 100 (CME)
may rise to 14880.00 – 14980.00
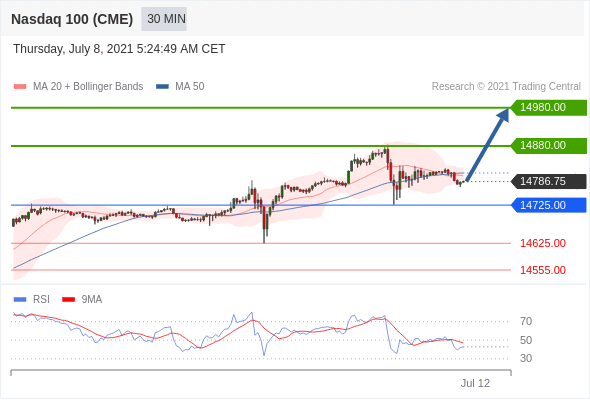
Pivot
14725.00
Our preference
Long positions above 14725.00 with targets at 14880.00 & 14980.00 in extension.
Alternative scenario
Below 14725.00 look for further downside with 14625.00 & 14555.00 as targets.
Comment
The RSI is mixed with a bullish bias.
Hang Seng (HKFE)
may fall to 27000.00 – 27250.00
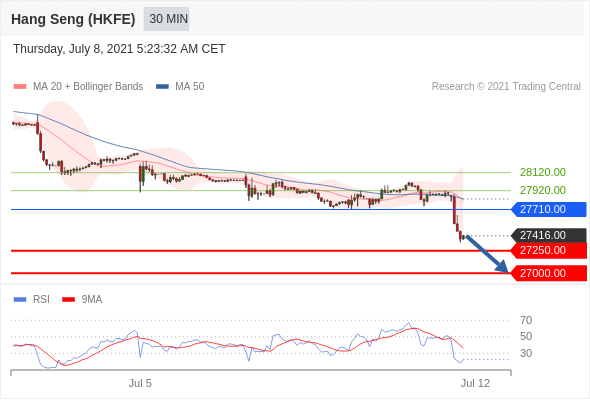
Pivot
27710.00
Our preference
Short positions below 27710.00 with targets at 27250.00 & 27000.00 in extension.
Alternative scenario
Above 27710.00 look for further upside with 27920.00 & 28120.00 as targets.
Comment
The RSI is bearish and calls for further decline.
Disclaimer:
This report is prepared and published by Trading Central for all clients of Doo Prime. As a third-party indicator tool, Trading Central is only for your strategic reference during the investment process and does not constitute advice or a recommendation by Doo Prime or Trading Central. Neither Doo Prime nor Trading Central are responsible to bear the relevant legal liabilities for the investment risks arising from your use of this report to make buying and selling decisions.