1. Daily technical analysis of selected currency pairs
EUR/GBP Bullish
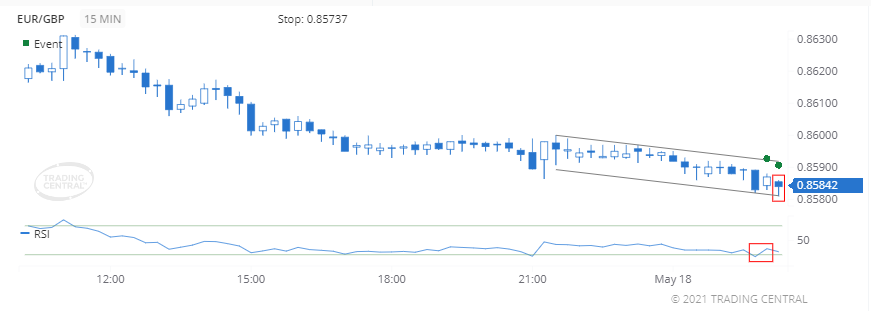
Image Features: forms “Hammer” pattern
Target
Opportunity recognized 2021 May 18 for the period of up to 12 hours
+0.00002 (02 pips) price change since the Technical Event at 0.85840
Technical Analysis
We found a pattern called Hammer on 2021 May 18 at 02:15 GMT on a 15 minute chart suggesting the outlook is bullish for up to 12 hours.
The RSI rose above 30 on 2021 May 18 at 02:00 GMT, telling us the price is starting to recover from being oversold.
NZD/JPY Bearish

Image Features: forms “Two Bar Reversal (Bearish)” pattern
Target
Opportunity recognized 2021 May 18 for the period of up to 12 hours
-0.005 (05 pips) price change since the Technical Event at 78.985
Technical Analysis
We found a pattern called Two Bar Reversal (Bearish) on 2021 May 18 at 02:10 GMT on a 5 minute chart suggesting the outlook is bearish for up to 12 hours.
A bearish event triggered for Slow Stochastics on 2021 May 18 at 02:20 GMT when the %K line crossed below the %D line. The close prices are trading closer to the lower end of the recent high-low price range, which is associated with price decreases
2. Daily Analyst’s View
EUR/USD
may rise 14 – 29 pips
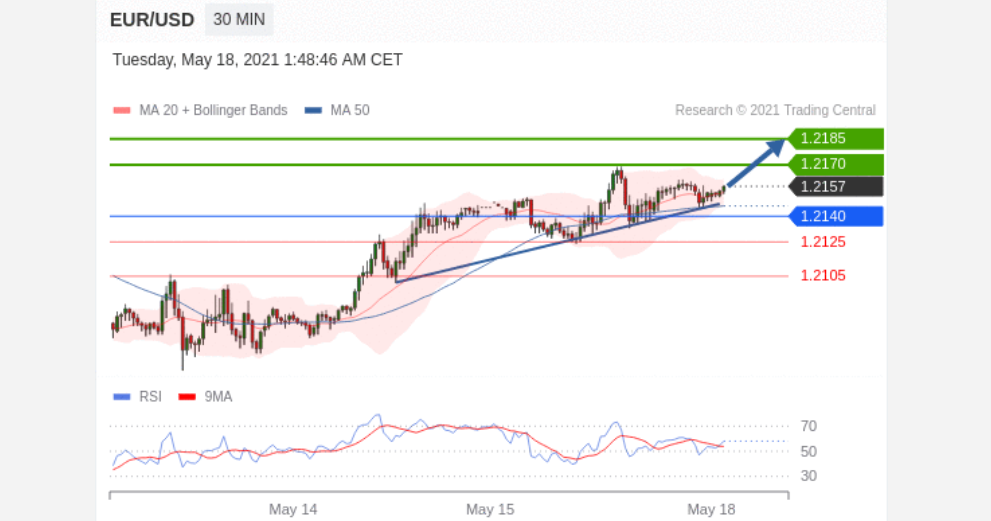
Pivot
1.2140
Our preference
Long positions above 1.2140 with targets at 1.2170 & 1.2185 in extension.
Alternative scenario
Below 1.2140 look for further downside with 1.2125 & 1.2105 as targets.
Comment
The RSI advocates for further advance.
GBP/USD
may rise 21 – 46 pips
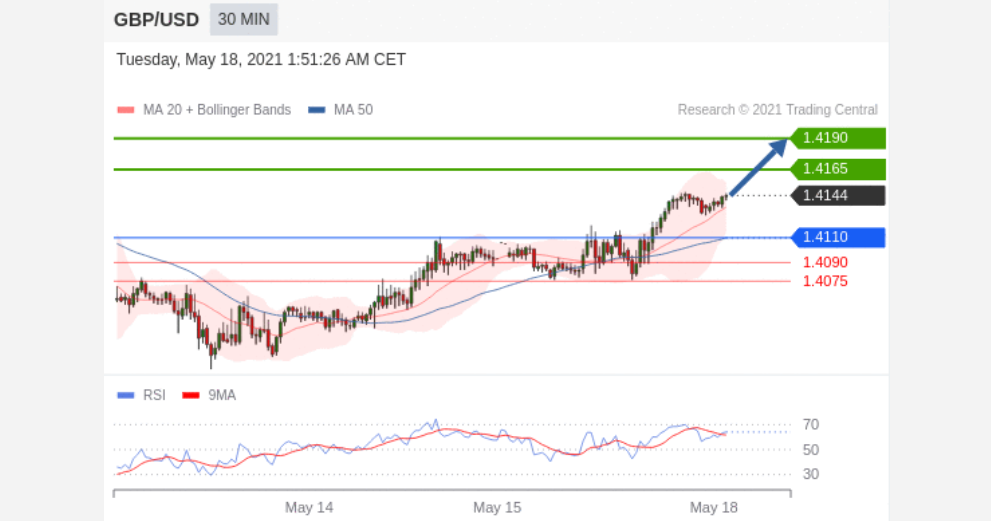
Pivot
1.4110
Our preference
Long positions above 1.4110 with targets at 1.4165 & 1.4190 in extension.
Alternative scenario
Below 1.4110 look for further downside with 1.4090 & 1.4075 as targets.
Comment
The RSI is bullish and calls for further advance.
USD/CAD
may fall 20 – 60 pips
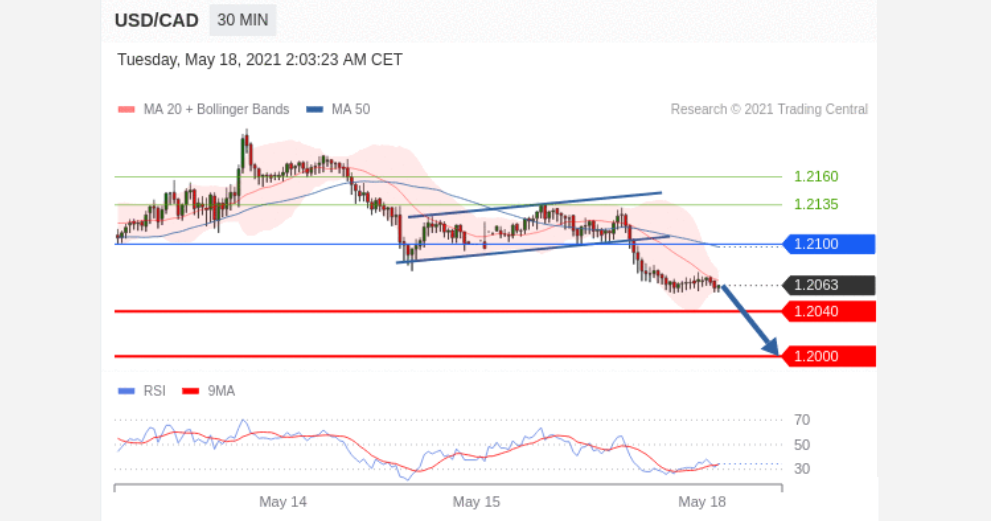
Pivot
1.2100
Our preference
Short positions below 1.2100 with targets at 1.2040 & 1.2000 in extension.
Alternative scenario
Above 1.2100 look for further upside with 1.2135 & 1.2160 as targets.
Comment
The RSI is bearish and calls for further decline.
Gold
may rise to 1879.00 – 1890.00
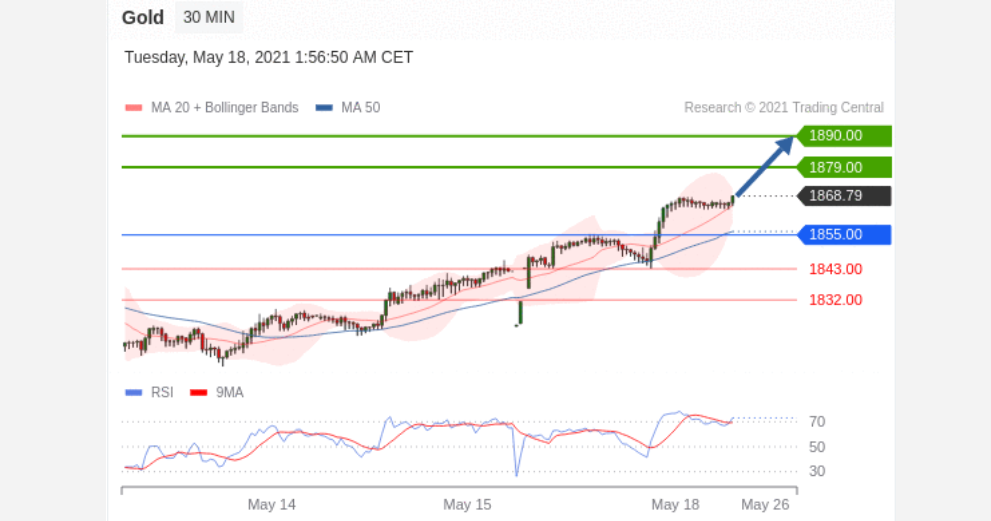
Pivot
1855.00
Our preference
Long positions above 1855.00 with targets at 1879.00 & 1890.00 in extension.
Alternative scenario
Below 1855.00 look for further downside with 1843.00 & 1832.00 as targets.
Comment
The RSI is bullish and calls for further advance.
Crude Oil (WTI)
may rise to 66.65 – 67.20
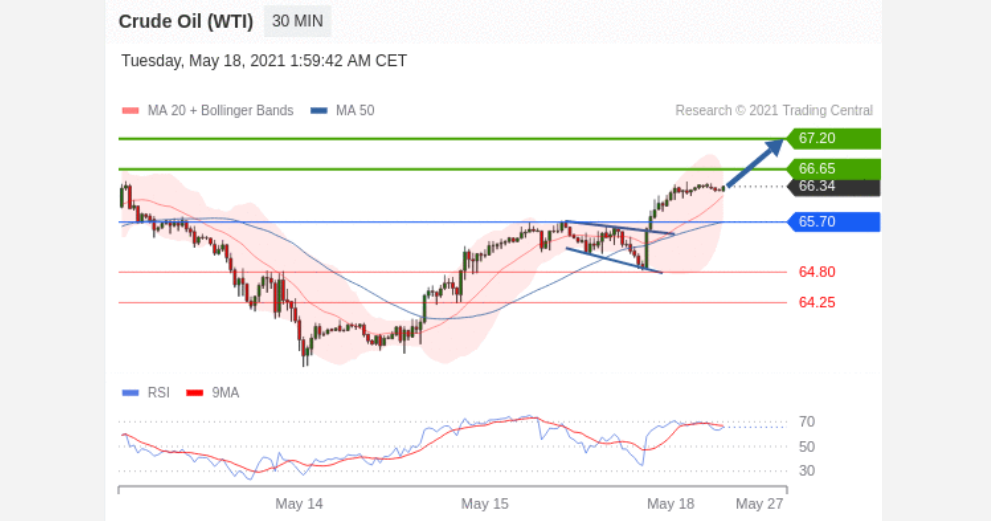
Pivot
65.70
Our preference
Long positions above 65.70 with targets at 66.65 & 67.20 in extension.
Alternative scenario
Below 65.70 look for further downside with 64.80 & 64.25 as targets.
Comment
The RSI is bullish and calls for further upside.
S&P 500 (CME)
may rise to 4178.00 – 4220.00
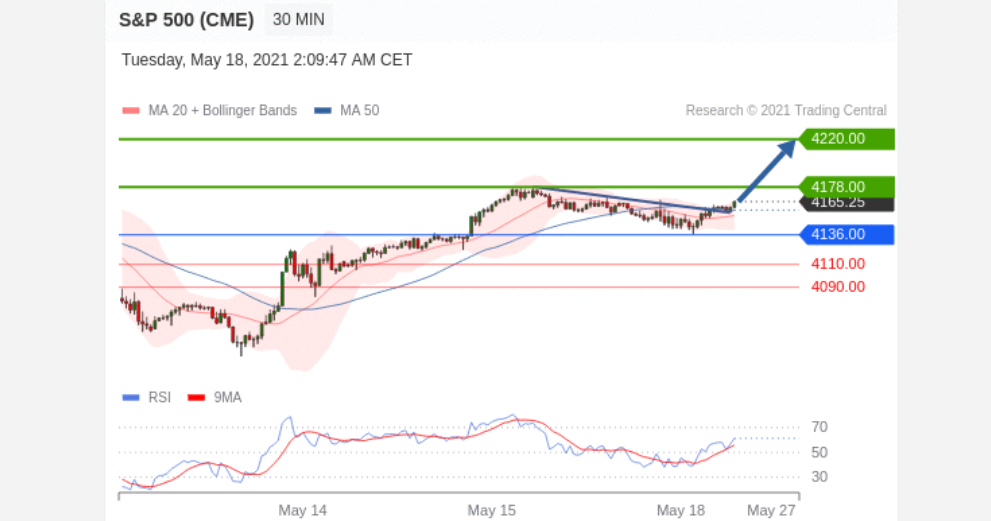
Pivot
4136.00
Our preference
Long positions above 4136.00 with targets at 4178.00 & 4220.00 in extension.
Alternative scenario
Below 4136.00 look for further downside with 4110.00 & 4090.00 as targets.
Comment
The RSI calls for a new upleg.
Nasdaq 100 (CME)
may rise to 13450.00 – 13525.00
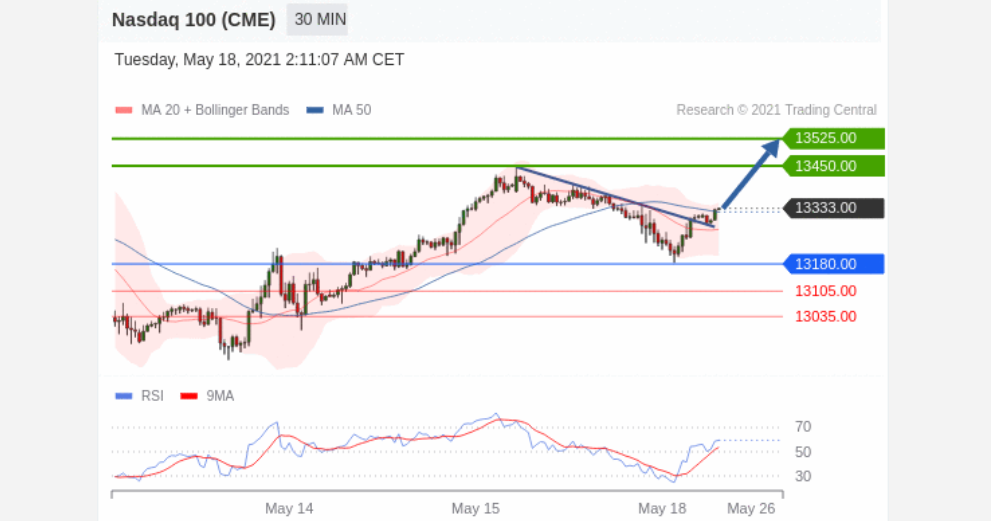
Pivot
13180.00
Our preference
Long positions above 13180.00 with targets at 13450.00 & 13525.00 in extension.
Alternative scenario
Below 13180.00 look for further downside with 13105.00 & 13035.00 as targets.
Comment
The RSI shows upside momentum.
FTSE China A50
may rise to 18664.50 – 18995.05
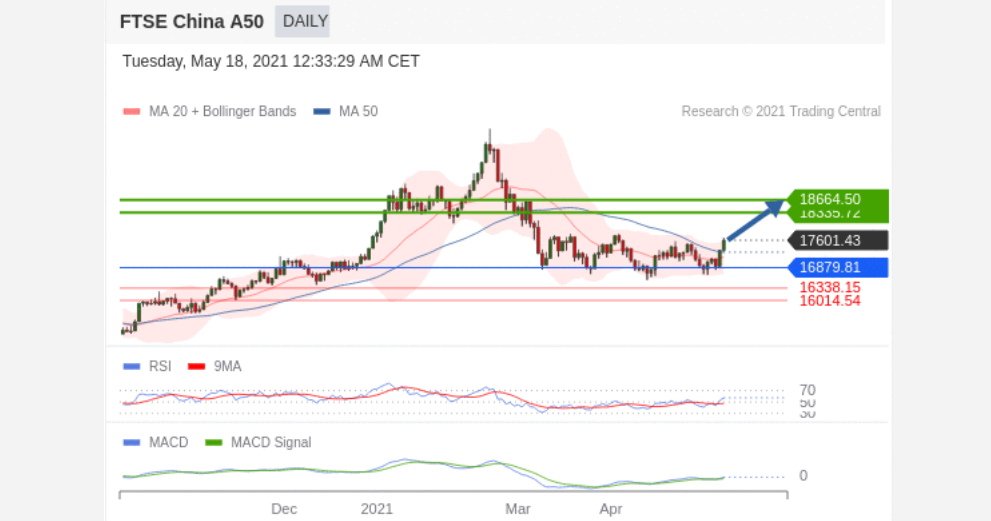
Pivot
16879.81
Our preference
Our next up target stands at 18664.50.
Alternative scenario
Below 16879.81, expect 16338.15 and 16014.54.
Comment
The RSI is above 50. The MACD is above its signal line and negative. The MACD must break above its zero level to call for further upside. FTSE China A50 index is trading above both its 20 and 50 period moving average (respectively at 17161.14 and 17286.69).
Disclaimer:
This report is prepared and published by Trading Central for all clients of Doo Prime. As a third-party indicator tool, Trading Central is only for your strategic reference during the investment process and does not constitute advice or a recommendation by Doo Prime or Trading Central. Neither Doo Prime nor Trading Central are responsible to bear the relevant legal liabilities for the investment risks arising from your use of this report to make buying and selling decisions.