1. Daily technical analysis of selected currency pairs
GBP/HKD Bullish
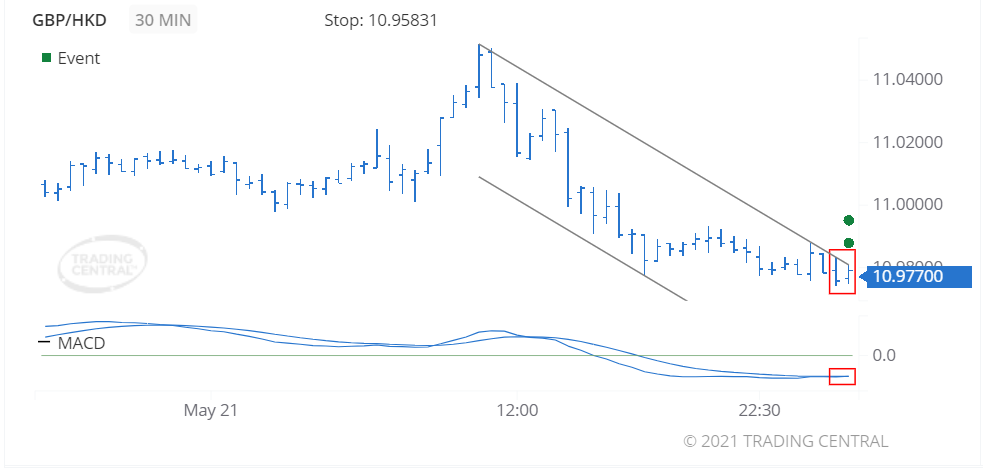
Image Features: forms “Inside Bar (Bullish)” pattern
Target
Opportunity recognized 2021 May 24 for the period of up to 12 hours
-0.00205 (205 pips) price change since the Technical Event at 10.97905
Technical Analysis
We found a pattern called Inside Bar (Bullish) on 2021 May 24 at 02:00 GMT on a 30 minute chart suggesting the outlook is bullish for up to 12 hours.
The MACD generated a bullish signal on 2021 May 24 at 02:00 GMT.
EUR/AUD Bearish
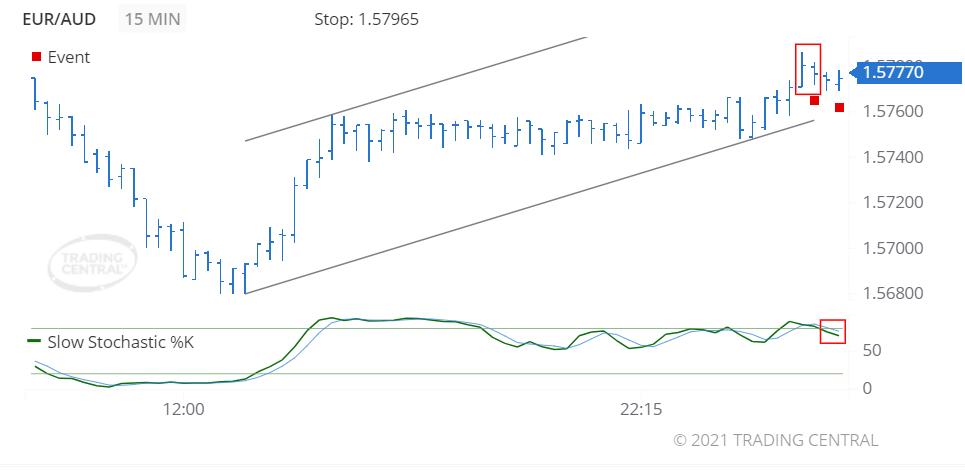
Image Features: forms “Inside Bar (Bearish)” pattern
Target
Opportunity recognized 2021 May 24 for the period of up to 12 hours
+0.00004 (0.4 pips) price change since the Technical Event at 1.57766
Technical Analysis
We found a pattern called Inside Bar (Bearish) on 2021 May 24 at 01:45 GMT on a 15 minute chart suggesting the outlook is bearish for up to 12 hours.
A bearish event triggered for Slow Stochastics on 2021 May 24 at 02:15 GMT when the %K line crossed below the %D line. The close prices are trading closer to the lower end of the recent high-low price range, which is associated with price decreases.
2. Daily Analyst’s View
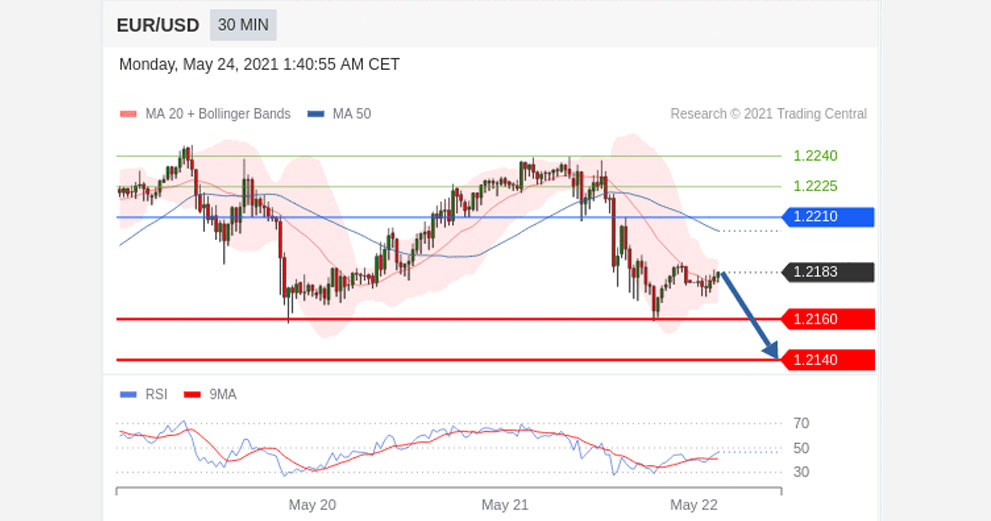
EUR/USD
may fall 22 – 42 pips
Pivot
1.2210
Our preference
Short positions below 1.2210 with targets at 1.2160 & 1.2140 in extension.
Alternative scenario
Above 1.2210 look for further upside with 1.2225 & 1.2240 as targets.
Comment
As long as the resistance at 1.2210 is not surpassed, the risk of the break below 1.2160 remains high.
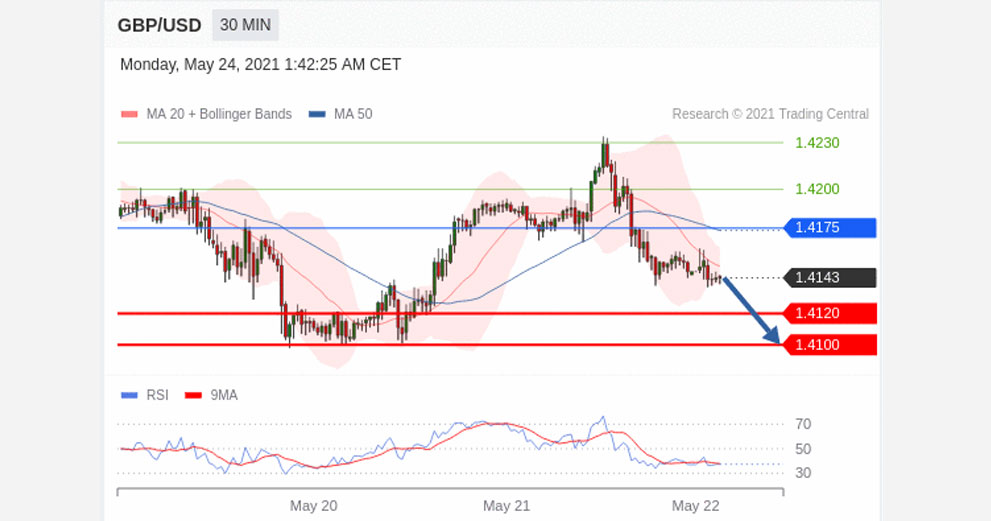
GBP/USD
may fall 24 – 44 pips
Pivot
1.4175
Our preference
Short positions below 1.4175 with targets at 1.4120 & 1.4100 in extension.
Alternative scenario
Above 1.4175 look for further upside with 1.4200 & 1.4230 as targets.
Comment
The RSI is bearish and calls for further decline.
USD/CAD
may rise 26 – 46 pips
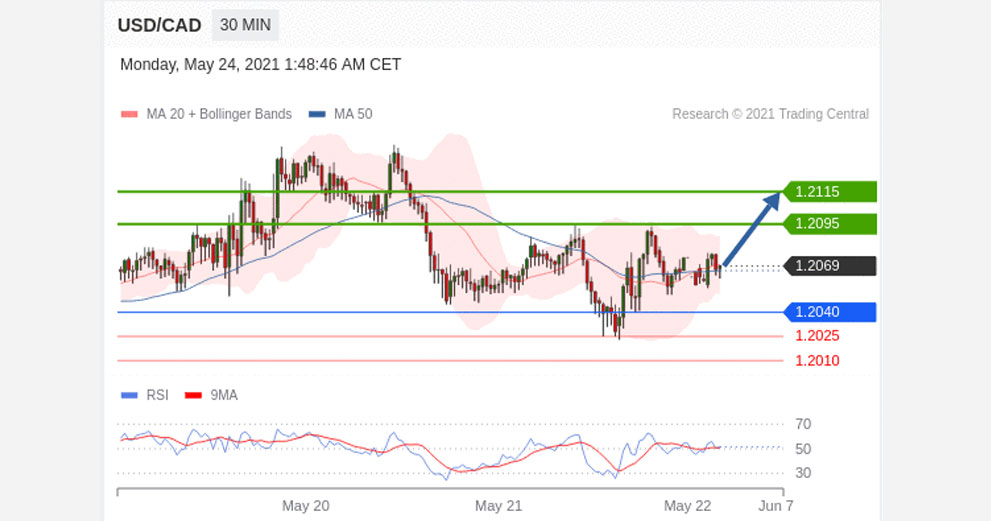
Pivot
1.2040
Our preference
Long positions above 1.2040 with targets at 1.2095 & 1.2115 in extension.
Alternative scenario
Below 1.2040 look for further downside with 1.2025 & 1.2010 as targets.
Comment
The RSI is mixed with a bullish bias.
Gold
may rise to 1890.00 – 1900.00
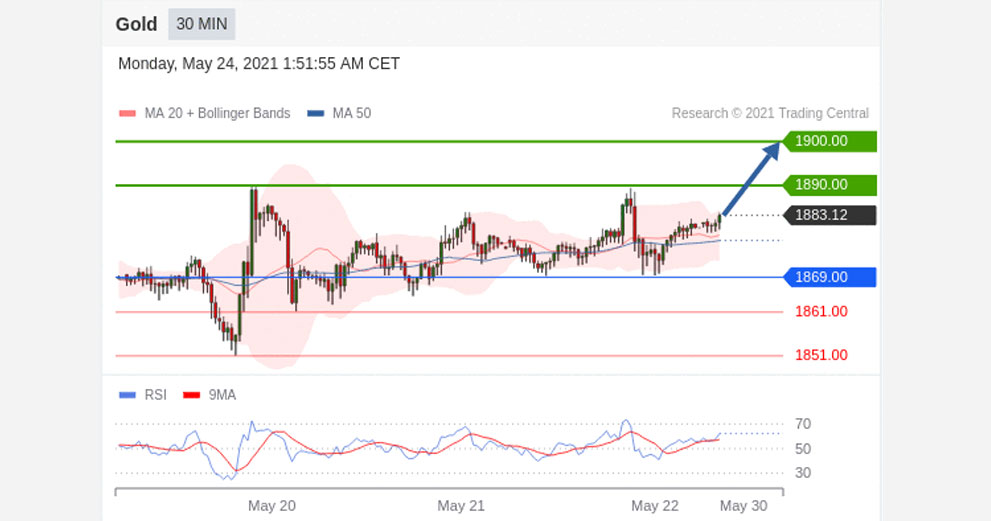
Pivot
1869.00
Our preference
Long positions above 1869.00 with targets at 1890.00 & 1900.00 in extension.
Alternative scenario
Below 1869.00 look for further downside with 1861.00 & 1851.00 as targets.
Comment
The RSI calls for a new upleg.
Crude Oil (WTI)
may rise to 64.55 – 65.00
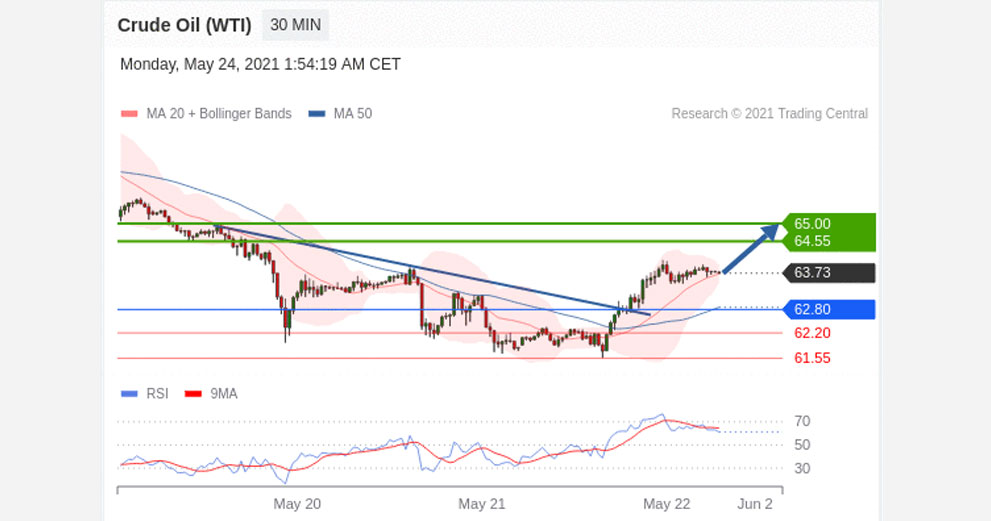
Pivot
62.80
Our preference
Long positions above 62.80 with targets at 64.55 & 65.00 in extension.
Alternative scenario
Below 62.80 look for further downside with 62.20 & 61.55 as targets.
Comment
The RSI is mixed with a bullish bias.
S&P 500 (CME)
may rise to 4185.00 – 4230.00
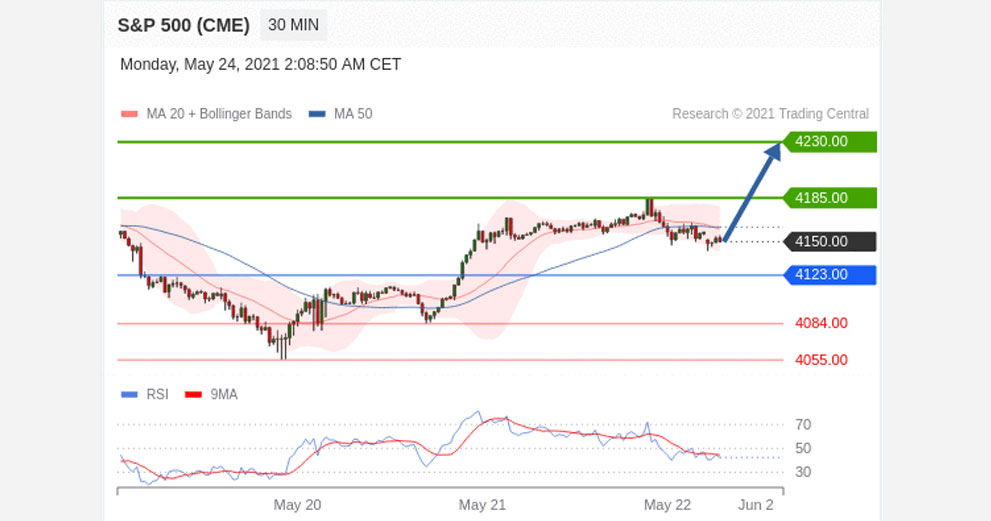
Pivot
4123.00
Our preference
Long positions above 4123.00 with targets at 4185.00 & 4230.00 in extension.
Alternative scenario
Below 4123.00 look for further downside with 4084.00 & 4055.00 as targets.
Comment
The RSI is mixed.
Nasdaq 100 (CME)
may rise to 13570.00 – 13680.00
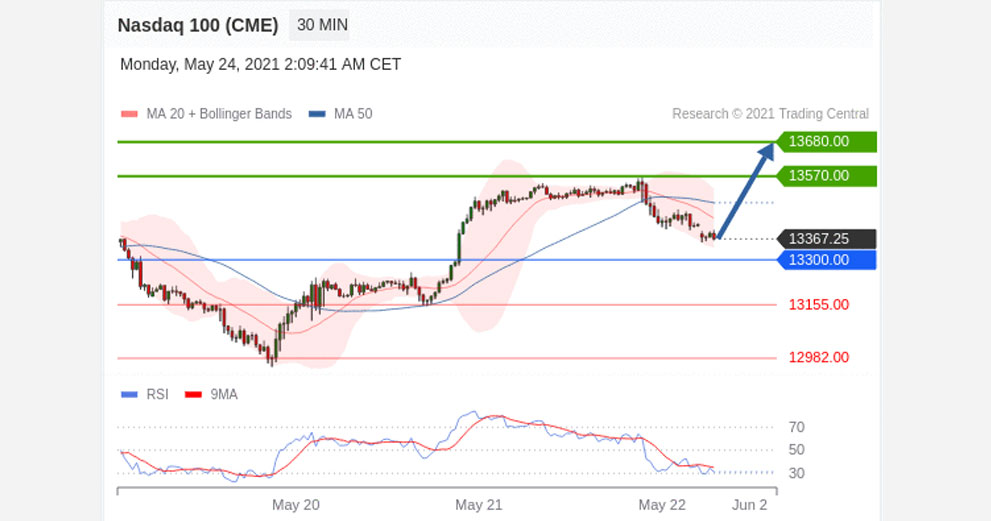
Pivot
13300.00
Our preference
Long positions above 13300.00 with targets at 13570.00 & 13680.00 in extension.
Alternative scenario
Below 13300.00 look for further downside with 13155.00 & 12982.00 as targets.
Comment
Even though a continuation of the consolidation cannot be ruled out, its extent should be limited.
FTSE China A50
may rise to 18668.49 – 18983.92
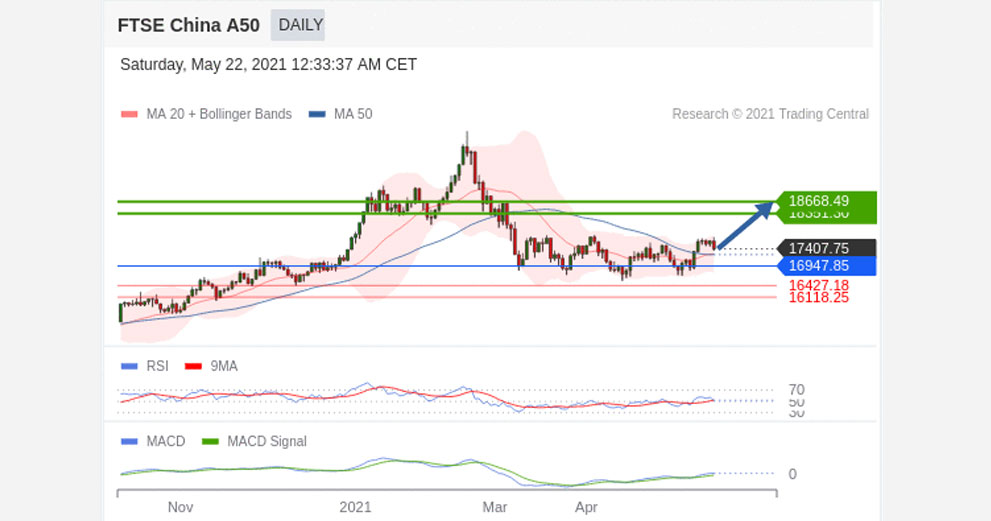
Pivot
16947.85.
Our preference
The upside prevails as long as 16947.85 is support.
Alternative scenario
Below 16947.85, expect 16427.18 and 16118.25.
Comment
The RSI is above its neutrality area at 50. The MACD is positive and above its signal line. The configuration is positive. FTSE China A50 index is above its 20 and 50 period moving average (respectively at 17272.80 and 17253.17).
Disclaimer:
This report is prepared and published by Trading Central for all clients of Doo Prime. As a third-party indicator tool, Trading Central is only for your strategic reference during the investment process and does not constitute advice or a recommendation by Doo Prime or Trading Central. Neither Doo Prime nor Trading Central are responsible to bear the relevant legal liabilities for the investment risks arising from your use of this report to make buying and selling decisions.