1. Daily technical analysis of selected currency pairs
GBP/AUD Bullish
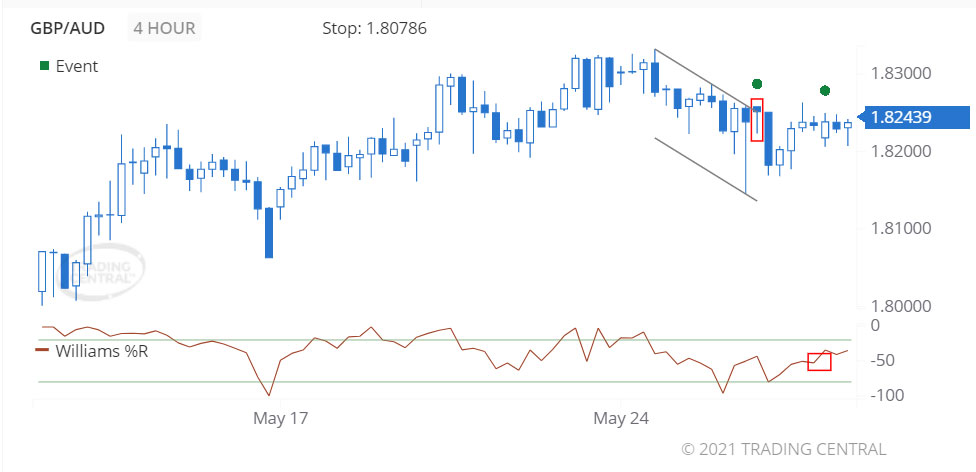
Image Features: forms “Hammer” pattern
Target
Opportunity recognized 2021 May 26 for the period of up to 48 hours
-0.00073 (7.3 pips) price change since the Technical Event at 1.82512
Technical Analysis
We found a pattern called Hammer on 2021 May 26 at 01:00 GMT on a 4 hour chart suggesting the outlook is bullish for up to 48 hours.
The Williams %R indicator triggered a bullish signal on 2021 May 27 at 01:00 GMT, having risen up out of oversold (-80 level) and continued on to cross above the -50 level.
EUR/GBP Bearish
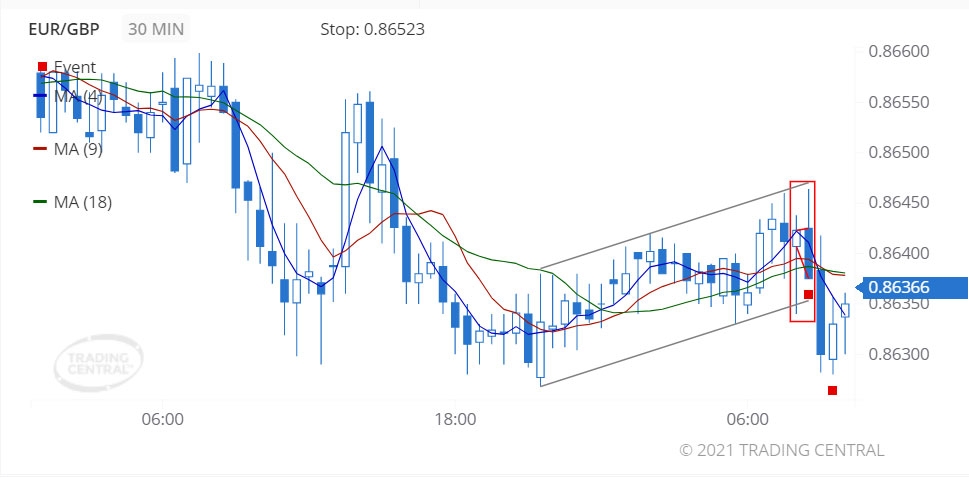
Image Features: forms “Engulfing Line (Bearish)” pattern
Target
Opportunity recognized 2021 May 27 for the period of up to 12 hours
-0.00017 (1.7 pips) price change since the Technical Event at 0.86375
Technical Analysis
We found a pattern called Engulfing Line (Bearish) on 2021 May 27 at 08:30 GMT on a 30 minute chart suggesting the outlook is bearish for up to 12 hours.
On 2021 May 27 at 09:30 GMT, the 4-bar Moving Average crossed below the 9-bar MA which crossed below the 18-bar MA, signaling a new downtrend has been established.
2. Daily Analyst’s View
EUR/USD
may fall 24 – 39 pips

Pivot
1.2220
Our preference
Short positions below 1.2220 with targets at 1.2160 & 1.2145 in extension.
Alternative scenario
Above 1.2220 look for further upside with 1.2240 & 1.2265 as targets.
Comment
The RSI is mixed to bearish.
GBP/USD
may fall 30 – 50 pips
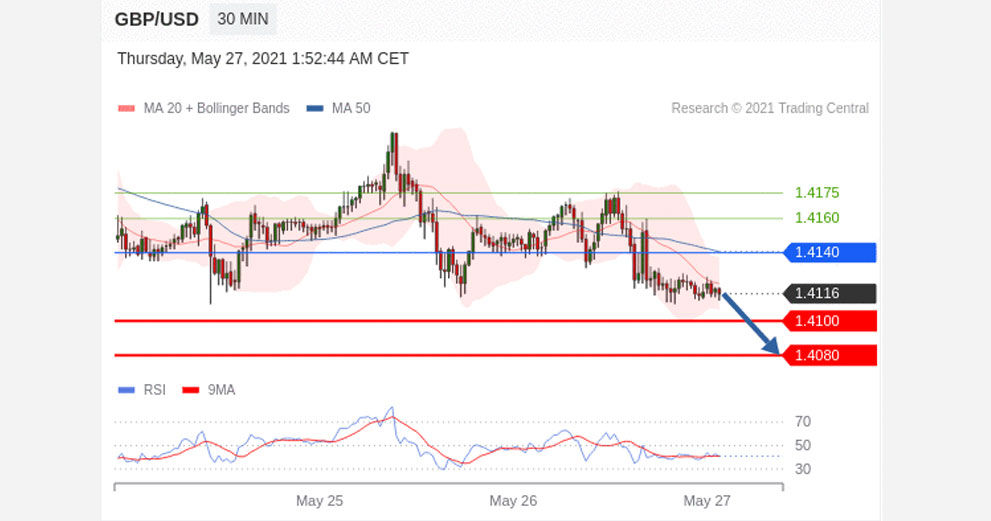
Pivot
1.4140
Our preference
Short positions below 1.4140 with targets at 1.4090 & 1.4070 in extension.
Alternative scenario
Above 1.4140 look for further upside with 1.4155 & 1.4175 as targets.
Comment
The RSI is mixed to bearish.
USD/CAD
may fall 25 – 40 pips
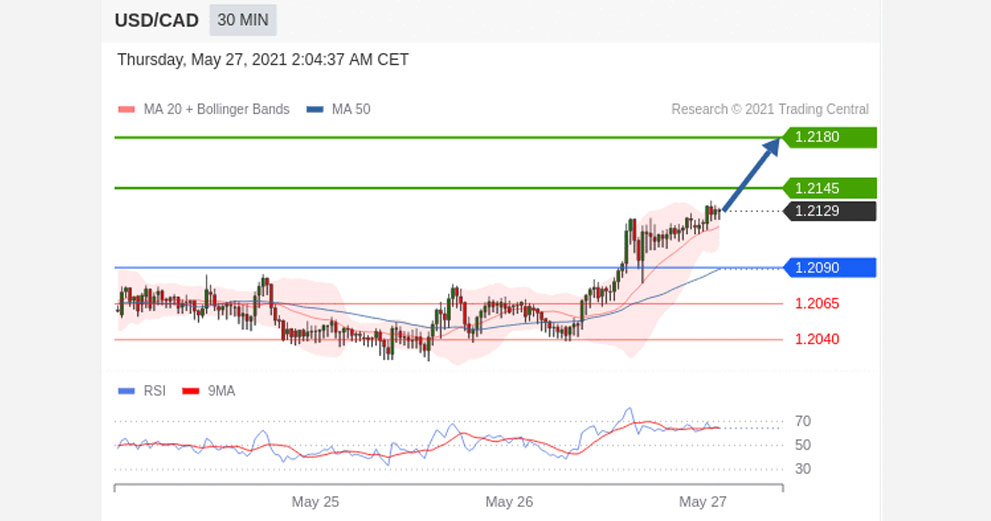
Pivot
1.2095
Our preference
Long positions above 1.2095 with targets at 1.2140 & 1.2165 in extension.
Alternative scenario
Below 1.2095 look for further downside with 1.2075 & 1.2055 as targets.
Comment
The RSI is mixed to bullish.
Gold
may fall to 1883.00 – 1890.00
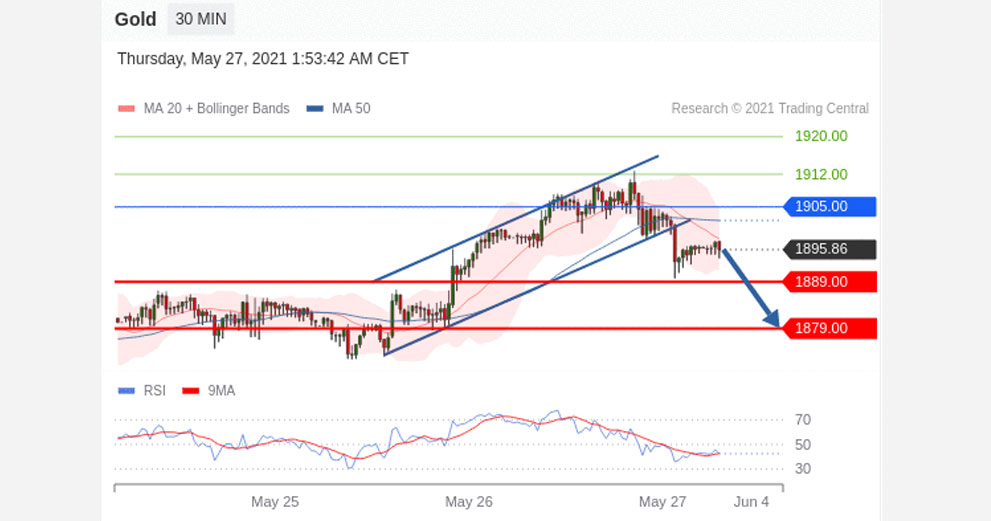
Pivot
1905.00
Our preference
Short positions below 1905.00 with targets at 1890.00 & 1883.00 in extension.
Alternative scenario
Above 1905.00 look for further upside with 1912.00 & 1919.00 as targets.
Comment
As long as the resistance at 1905.00 is not surpassed, the risk of the break below 1890.00 remains high.
Crude Oil (WTI)
may rise to 66.50 – 67.00
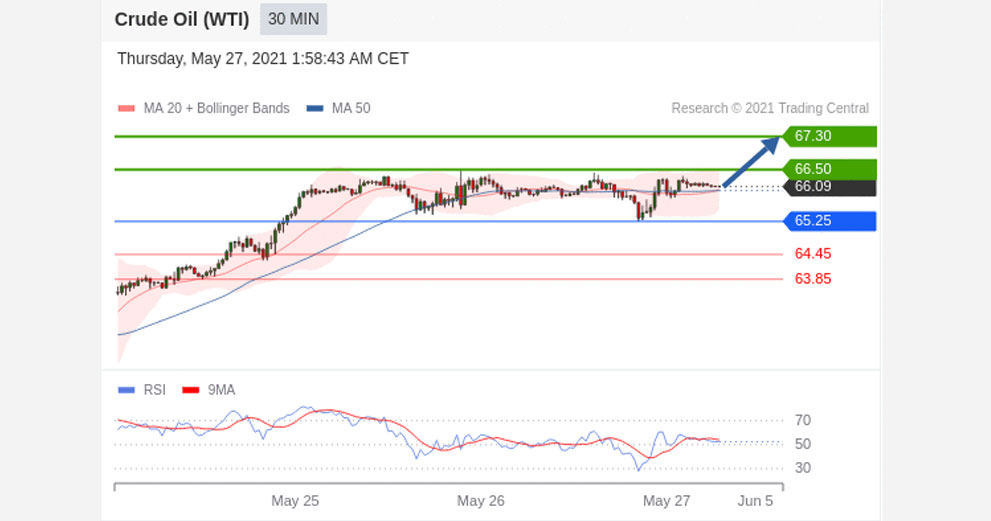
Pivot
65.25
Our preference
Long positions above 65.25 with targets at 66.50 & 67.00 in extension.
Alternative scenario
Below 65.25 look for further downside with 64.80 & 64.30 as targets.
Comment
A support base at 65.25 has formed and has allowed for a temporary stabilisation.
S&P 500 (CME)
may fall to 4150.00 – 4165.00
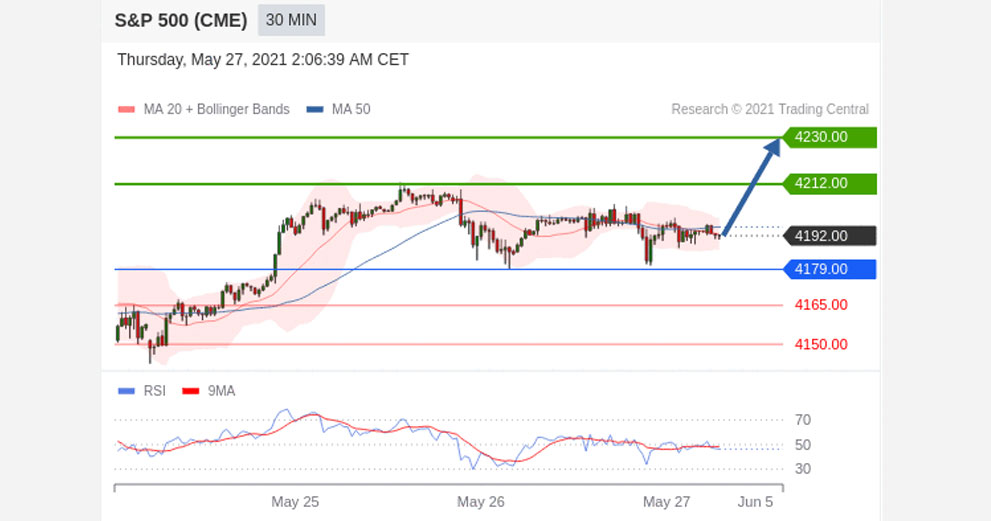
Pivot
4199.00
Our preference
Short positions below 4199.00 with targets at 4165.00 & 4150.00 in extension.
Alternative scenario
Above 4199.00 look for further upside with 4212.00 & 4230.00 as targets.
Comment
Intraday technical indicators lack momentum.
Nasdaq 100 (CME)
may fall to 13495.00 – 13575.00
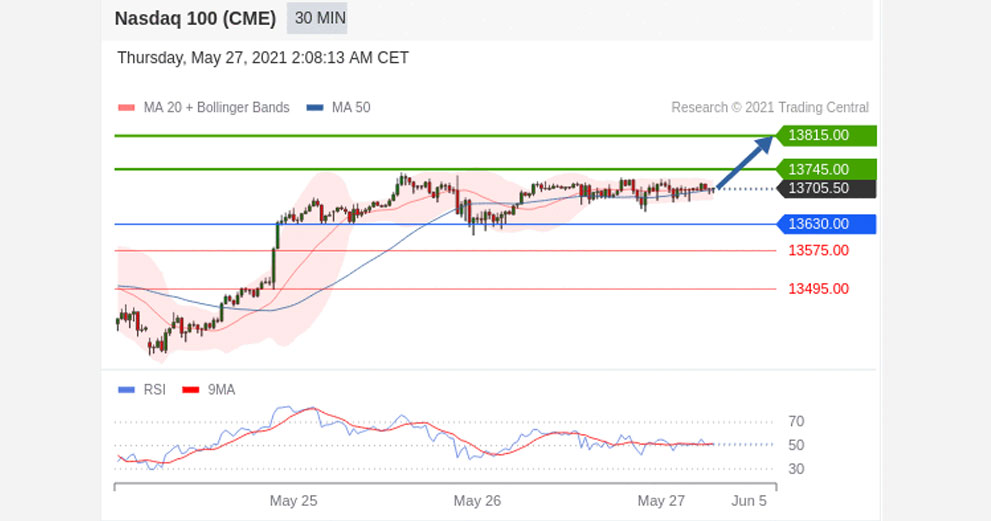
Pivot
13745.00
Our preference
Short positions below 13745.00 with targets at 13575.00 & 13495.00 in extension.
Alternative scenario
Above 13745.00 look for further upside with 13815.00 & 13945.00 as targets.
Comment
The RSI is mixed.
SGX FTSE China A50
may rise to 18490.00 – 18630.00
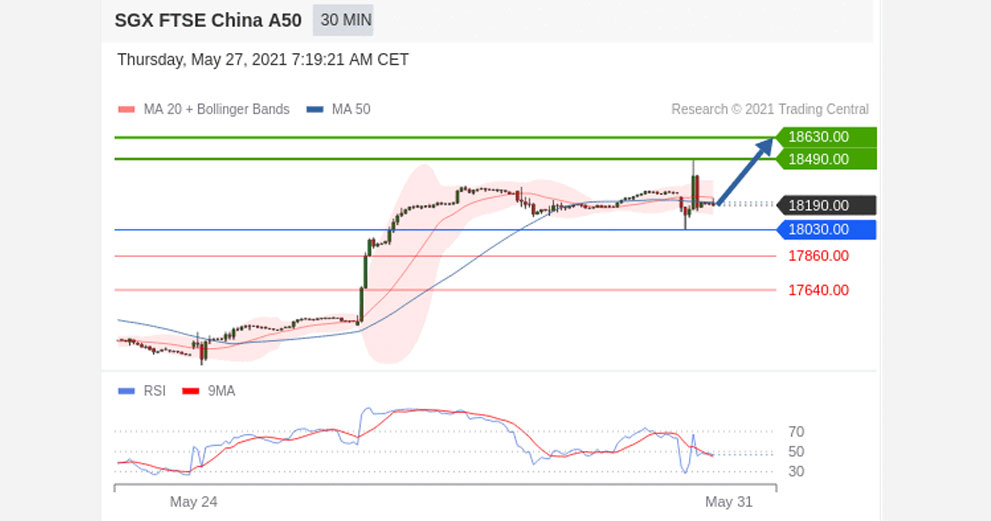
Pivot
18030.00
Our preference
Long positions above 18030.00 with targets at 18490.00 & 18630.00 in extension.
Alternative scenario
Below 18030.00 look for further downside with 17860.00 & 17640.00 as targets.
Comment
The RSI is mixed with a bullish bias.
Disclaimer:
This report is prepared and published by Trading Central for all clients of Doo Prime. As a third-party indicator tool, Trading Central is only for your strategic reference during the investment process and does not constitute advice or a recommendation by Doo Prime or Trading Central. Neither Doo Prime nor Trading Central are responsible to bear the relevant legal liabilities for the investment risks arising from your use of this report to make buying and selling decisions.