

1. Daily technical analysis of selected currency pairs
GBP/JPY Bearish
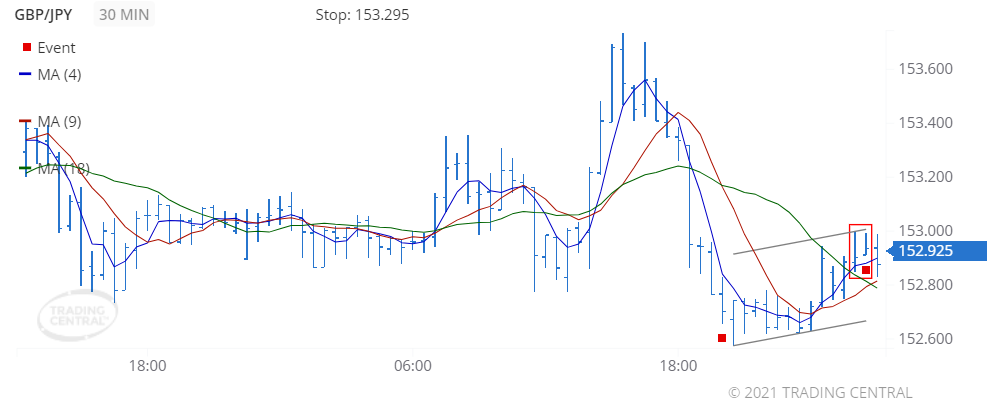
Image Features: forms “Inside Bar (Bearish)” pattern
Target
Opportunity recognized 2021 Nov 11 for the period of up to 12 hours
-0.010 (1 pips) price change since the Technical Event at 152.935
Technical Analysis
We found a pattern called Inside Bar (Bearish) on 2021 Nov 11 at 02:30 GMT on a 30 minute chart suggesting the outlook is bearish for up to 12 hours.
On 2021 Nov 10 at 20:00 GMT, the 4-bar Moving Average crossed below the 9-bar MA which crossed below the 18-bar MA, signaling a new downtrend has been established.
AUD/CAD Bearish
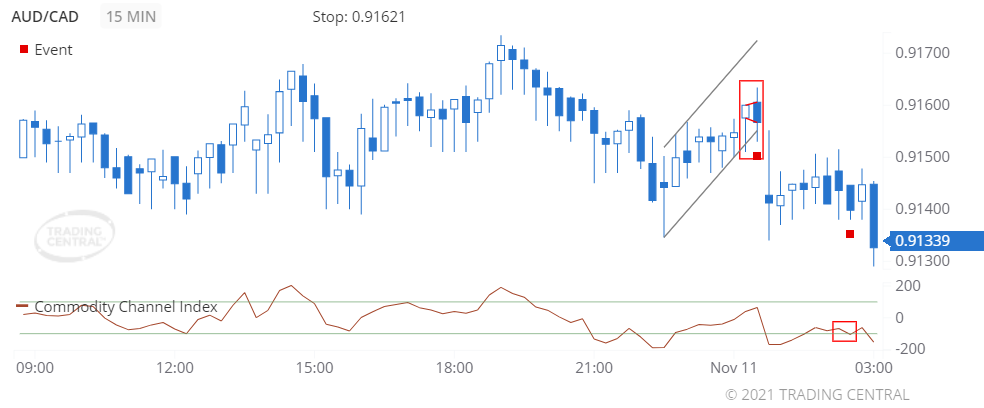
Image Features: forms “Engulfing Line (Bearish)” pattern
Target
Opportunity recognized 2021 Nov 11 for the period of up to 12 hours
-0.00228 (22.8 pips) price change since the Technical Event at 0.91567
Technical Analysis
We found a pattern called Engulfing Line (Bearish) on 2021 Nov 11 at 00:30 GMT on a 15 minute chart suggesting the outlook is bearish for up to 12 hours.
The CCI triggered a bearish signal on 2021 Nov 11 at 02:30 GMT by crossing below the -100% level.
2. Daily Analyst’s View
EUR/USD
may fall to 1.1290 – 1.1420
Pivot
1.1610
Our preference
Short positions below 1.1610 with targets at 1.1420 & 1.1290 in extension.
Alternative scenario
Above 1.1610 look for further upside with 1.1690 & 1.1800 as targets.
Comment
The RSI advocates for further decline.
GBP/USD
may fall to 1.3140 – 1.3300
Pivot
1.3610
Our preference
Short positions below 1.3610 with targets at 1.3300 & 1.3140 in extension.
Alternative scenario
Above 1.3610 look for further upside with 1.3730 & 1.3840 as targets.
Comment
The RSI is bearish and calls for further decline.
USD/CAD
may rise 26 – 46 pips

Pivot
1.2450
Our preference
Long positions above 1.2450 with targets at 1.2510 & 1.2530 in extension.
Alternative scenario
Below 1.2450 look for further downside with 1.2430 & 1.2410 as targets.
Comment
The RSI calls for a new upleg.
Gold
may rise to 1861.00 – 1869.00
Pivot
1837.00
Our preference
Long positions above 1837.00 with targets at 1861.00 & 1869.00 in extension.
Alternative scenario
Below 1837.00 look for further downside with 1826.00 & 1818.00 as targets.
Comment
The RSI is mixed with a bullish bias.
Crude Oil (WTI)
may fall to 80.05 – 80.80
Pivot
82.25
Our preference
Short positions below 82.25 with targets at 80.80 & 80.05 in extension.
Alternative scenario
Above 82.25 look for further upside with 83.00 & 83.70 as targets.
Comment
As long as the resistance at 82.25 is not surpassed, the risk of the break below 80.80 remains high.
S&P 500 (CME)
may fall to 4613.00 – 4625.00
Pivot
4658.00
Our preference
Short positions below 4658.00 with targets at 4625.00 & 4613.00 in extension.
Alternative scenario
Above 4658.00 look for further upside with 4678.00 & 4700.00 as targets.
Comment
As long as the resistance at 4658.00 is not surpassed, the risk of the break below 4625.00 remains high.
Nasdaq 100 (CME)
may fall to 15770.00 – 15890.00
Pivot
16040.00
Our preference
Short positions below 16040.00 with targets at 15890.00 & 15770.00 in extension.
Alternative scenario
Above 16040.00 look for further upside with 16110.00 & 16240.00 as targets.
Comment
A break below 15890.00 would trigger a drop towards 15770.00.
Hang Seng (HKFE)
may rise to 25035.00 – 25230.00
Pivot
24670.00
Our preference
Long positions above 24670.00 with targets at 25035.00 & 25230.00 in extension.
Alternative scenario
Below 24670.00 look for further downside with 24430.00 & 24200.00 as targets.
Comment
The next resistances are at 25035.00 and then at 25230.00.
Disclaimer:
This report is prepared and published by Trading Central for all clients of Doo Prime. As a third-party indicator tool, Trading Central is only for your strategic reference during the investment process and does not constitute advice or a recommendation by Doo Prime or Trading Central. Neither Doo Prime nor Trading Central are responsible to bear the relevant legal liabilities for the investment risks arising from your use of this report to make buying and selling decisions.