

1. Daily technical analysis of selected currency pairs
AUD/JPY Bullish
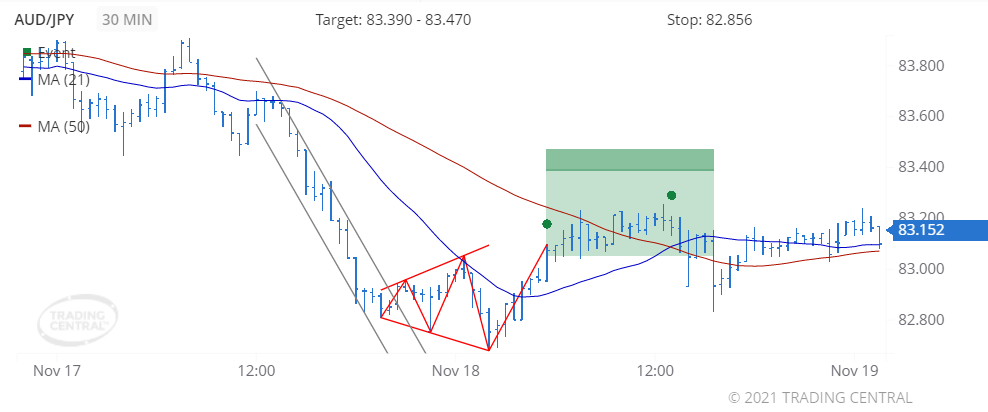
Image Features: forms “Megaphone Bottom (Bullish)” pattern
Target
Opportunity recognized 2021 Nov 18 for the period of up to 48 hours
+0.098 (9.8 pips) price change since the Technical Event at 83.054
Technical Analysis
We found a pattern called Megaphone Bottom on 2021 Nov 18 at 05:30 GMT on a 30 minute chart, providing a target price for up to 48 hours in the range of 83.390 to 83.470.
The faster moving average crossed above the slower moving average on 2021 Nov 18 at 13:00 GMT, signaling a new uptrend has been established.
EUR/GBP Bullish
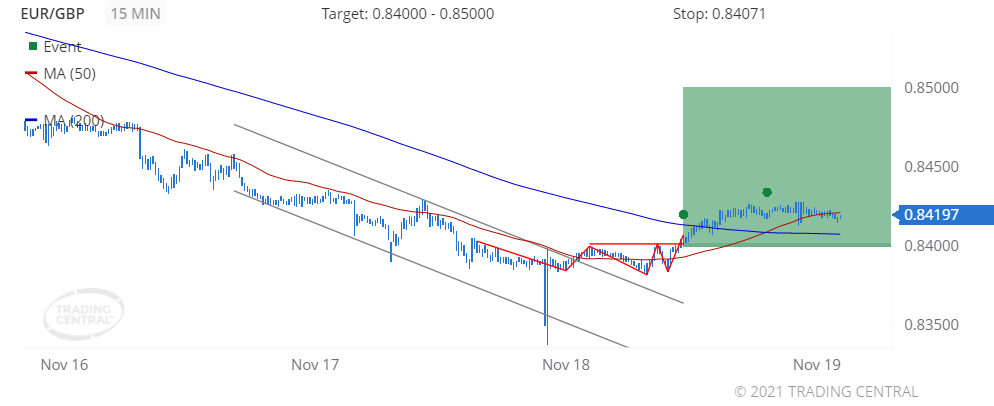
Image Features: forms “Triple Bottom (Bullish)” pattern
Target
Opportunity recognized 2021 Nov 18 for the period of up to 48 hours
+0.00182 (18.2 pips) price change since the Technical Event at 0.84015
Technical Analysis
We found a pattern called Triple Bottom on 2021 Nov 18 at 11:15 GMT on a 15 minute chart, providing a target price for up to 48 hours in the range of 0.84000 to 0.85000.
The faster moving average crossed above the slower moving average on 2021 Nov 18 at 19:15 GMT, signaling a new uptrend has been established.
2. Daily Analyst’s View
EUR/USD
may rise 21 – 41 pips
Pivot
1.1340
Our preference
Long positions above 1.1340 with targets at 1.1390 & 1.1410 in extension.
Alternative scenario
Below 1.1340 look for further downside with 1.1325 & 1.1310 as targets.
Comment
The RSI advocates for further upside.
GBP/USD
may rise 30 – 45 pips
Pivot
1.3465
Our preference
Long positions above 1.3465 with targets at 1.3530 & 1.3545 in extension.
Alternative scenario
Below 1.3465 look for further downside with 1.3450 & 1.3435 as targets.
Comment
The RSI calls for a bounce.
USD/CAD
may fall 22 – 42 pips
Pivot
1.2625
Our preference
Short positions below 1.2625 with targets at 1.2580 & 1.2560 in extension.
Alternative scenario
Above 1.2625 look for further upside with 1.2645 & 1.2660 as targets.
Comment
The RSI advocates for further downside.
Gold
may fall to 1848.50 – 1854.50
Pivot
1865.50
Our preference
Short positions below 1865.50 with targets at 1854.50 & 1848.50 in extension.
Alternative scenario
Above 1865.50 look for further upside with 1870.00 & 1875.00 as targets.
Comment
The RSI is mixed to bearish.
Crude Oil (WTI)
may rise to 78.80 – 79.50
Pivot
77.40
Our preference
Long positions above 77.40 with targets at 78.80 & 79.50 in extension.
Alternative scenario
Below 77.40 look for further downside with 76.95 & 76.45 as targets.
Comment
The RSI is mixed with a bullish bias.
S&P 500 (CME)
may rise to 4710.00 – 4720.00
Pivot
4694.00
Our preference
Long positions above 4694.00 with targets at 4710.00 & 4720.00 in extension.
Alternative scenario
Below 4694.00 look for further downside with 4684.00 & 4673.00 as targets.
Comment
The RSI calls for a new upleg.
Nasdaq 100 (CME)
may rise to 16560.00 – 16635.00
Pivot
16405.00
Our preference
Long positions above 16405.00 with targets at 16560.00 & 16635.00 in extension.
Alternative scenario
Below 16405.00 look for further downside with 16330.00 & 16280.00 as targets.
Comment
The RSI is bullish and calls for further advance.
Hang Seng (HKFE)
may fall to 24630.00 – 24790.00
Pivot
25140.00
Our preference
Short positions below 25140.00 with targets at 24790.00 & 24630.00 in extension.
Alternative scenario
Above 25140.00 look for further upside with 25340.00 & 25470.00 as targets.
Comment
As long as 25140.00 is resistance, likely decline to 24790.00.
Disclaimer:
This report is prepared and published by Trading Central for all clients of Doo Prime. As a third-party indicator tool, Trading Central is only for your strategic reference during the investment process and does not constitute advice or a recommendation by Doo Prime or Trading Central. Neither Doo Prime nor Trading Central are responsible to bear the relevant legal liabilities for the investment risks arising from your use of this report to make buying and selling decisions.