

1. Daily technical analysis of selected currency pairs
AUD/JPY Bullish
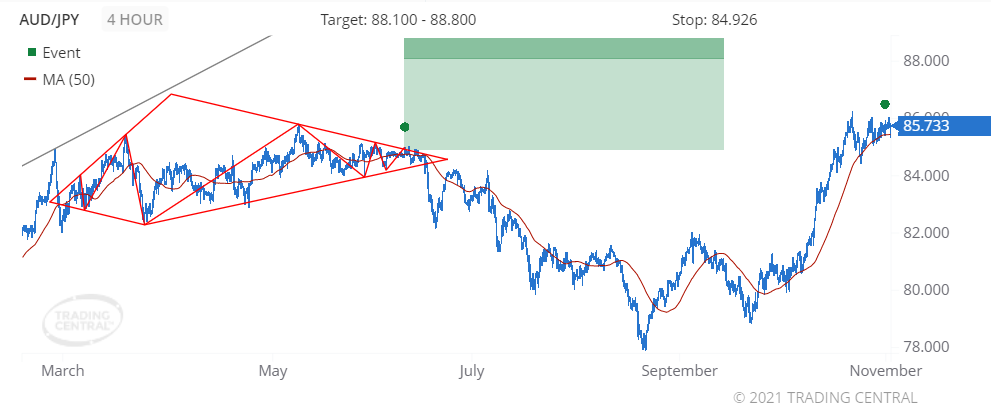
Image Features: forms “Continuation Diamond (Bullish)” pattern
Target
Opportunity recognized 2021 Jun 10 for the period of up to 2 weeks
+0.810 (81 pips) price change since the Technical Event at 84.923
Technical Analysis
We found a pattern called Continuation Diamond (Bullish) on 2021 Jun 10 at 13:00 GMT on a 4 hour chart, providing a target price for up to 2 weeks in the range of 88.100 to 88.800.
The price crossed above its moving average on 2021 Oct 30 at 01:00 GMT signaling a new uptrend has been established.
CAD/JPY Bullish
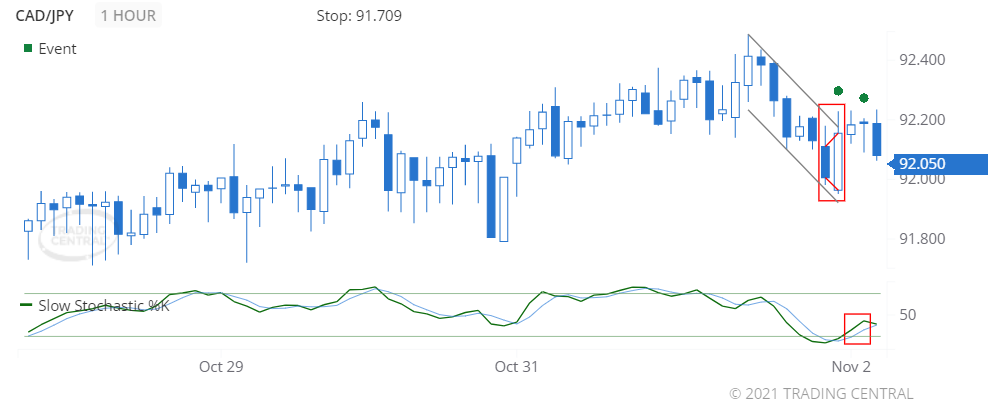
Image Features: forms “Engulfing Line (Bullish)” pattern
Target
Opportunity recognized 2021 Nov 01 for the period of up to 12 hours
-0.105 (10.5 pips) price change since the Technical Event at 92.155
Technical Analysis
We found a pattern called Engulfing Line (Bullish) on 2021 Nov 01 at 23:00 GMT on a 1 hour chart suggesting the outlook is bullish for up to 12 hours.
A bullish event triggered for Slow Stochastics on 2021 Nov 02 at 01:00 GMT when the %K line crossed above the %D line. The close prices are trading closer to the upper end of the recent high-low price range, which is associated with price increases.
2. Daily Analyst’s View
EUR/USD
may rise 30 – 50 pips
Pivot
1.1570
Our preference
Long positions above 1.1570 with targets at 1.1630 & 1.1650 in extension.
Alternative scenario
Below 1.1570 look for further downside with 1.1550 & 1.1530 as targets.
Comment
The RSI is bullish and calls for further advance.
GBP/USD
may fall 18 – 38 pips
Pivot
1.3690
Our preference
Short positions below 1.3690 with targets at 1.3640 & 1.3620 in extension.
Alternative scenario
Above 1.3690 look for further upside with 1.3710 & 1.3730 as targets.
Comment
As long as 1.3690 is resistance, look for choppy price action with a bearish bias.
USD/CAD
may fall 26 – 46 pips
Pivot
1.2395
Our preference
Short positions below 1.2395 with targets at 1.2350 & 1.2330 in extension.
Alternative scenario
Above 1.2395 look for further upside with 1.2410 & 1.2430 as targets.
Comment
As long as the resistance at 1.2395 is not surpassed, the risk of the break below 1.2350 remains high.
Gold
may rise to 1799.00 – 1810.00
Pivot
1780.00
Our preference
Long positions above 1780.00 with targets at 1799.00 & 1810.00 in extension.
Alternative scenario
Below 1780.00 look for further downside with 1771.00 & 1762.00 as targets.
Comment
The RSI calls for a bounce.
Crude Oil (WTI)
may rise to 84.90 – 85.50
Pivot
83.35
Our preference
Long positions above 83.35 with targets at 84.90 & 85.50 in extension.
Alternative scenario
Below 83.35 look for further downside with 82.45 & 81.60 as targets.
Comment
The RSI is mixed with a bullish bias.
S&P 500 (CME)
may rise to 4619.00 – 4642.00
Pivot
4580.00
Our preference
Long positions above 4580.00 with targets at 4619.00 & 4642.00 in extension.
Alternative scenario
Below 4580.00 look for further downside with 4559.00 & 4544.00 as targets.
Comment
The RSI is below its neutrality area at 50% but reversing up.
Nasdaq 100 (CME)
may rise to 15985.00 – 16080.00
Pivot
15760.00
Our preference
Long positions above 15760.00 with targets at 15985.00 & 16080.00 in extension.
Alternative scenario
Below 15760.00 look for further downside with 15690.00 & 15600.00 as targets.
Comment
The RSI is bullish and calls for further upside.
Hang Seng (HKFE)
may rise to 25700.00 – 26010.00

Pivot
25140.00
Our preference
Long positions above 25140.00 with targets at 25700.00 & 26010.00 in extension.
Alternative scenario
Below 25140.00 look for further downside with 24920.00 & 24790.00 as targets.
Comment
The RSI advocates for further upside.
Disclaimer:
This report is prepared and published by Trading Central for all clients of Doo Prime. As a third-party indicator tool, Trading Central is only for your strategic reference during the investment process and does not constitute advice or a recommendation by Doo Prime or Trading Central. Neither Doo Prime nor Trading Central are responsible to bear the relevant legal liabilities for the investment risks arising from your use of this report to make buying and selling decisions.