

1. Daily technical analysis of selected currency pairs
GBP/AUD Bullish
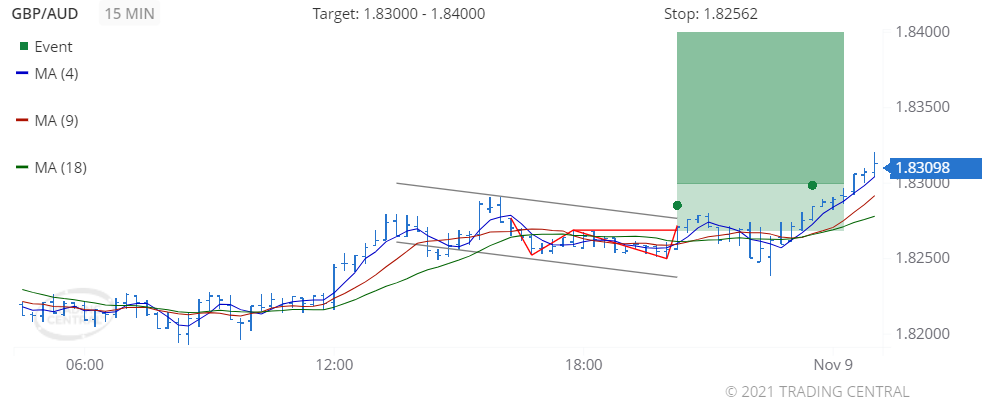
Image Features: forms “Double Bottom (Bullish)” pattern
Target
Opportunity recognized 2021 Nov 08 for the period of up to 12 hours
+0.00409 (40.9 pips) price change since the Technical Event at 1.82689
Technical Analysis
We found a pattern called Double Bottom on 2021 Nov 08 at 20:15 GMT on a 15 minute chart, providing a target price for up to 12 hours in the range of 1.83000 to 1.84000.
On 2021 Nov 08 at 23:30 GMT, the 4-bar Moving Average crossed above the 9-bar MA which crossed above the 18-bar MA, signaling a new uptrend has been established.
CAD/JPY Bearish
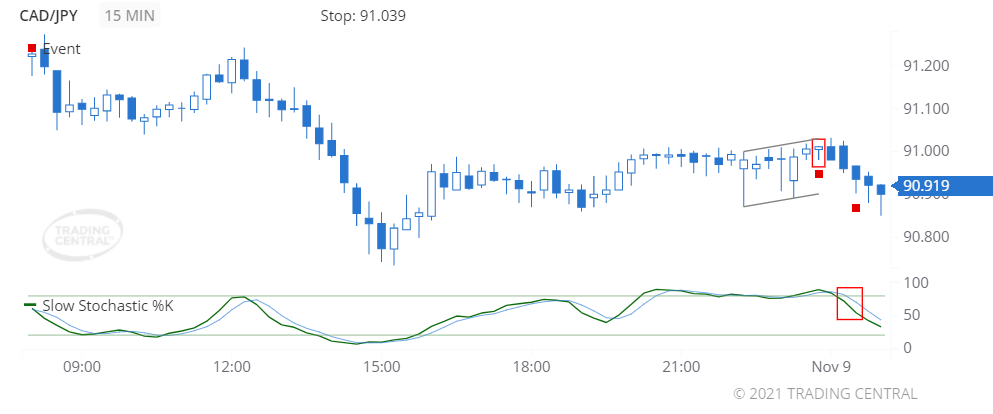
Image Features: forms “Hanging Man (Bearish)” pattern
Target
Opportunity recognized 2021 Nov 08 for the period of up to 12 hours
-0.092 (9.2 pips) price change since the Technical Event at 91.011
Technical Analysis
We found a pattern called Hanging Man on 2021 Nov 08 at 23:45 GMT on a 15 minute chart suggesting the outlook is bearish for up to 12 hours.
A bearish event triggered for Slow Stochastics on 2021 Nov 09 at 00:30 GMT when the %K line crossed below the %D line. The close prices are trading closer to the lower end of the recent high-low price range, which is associated with price decreases.
2. Daily Analyst’s View
EUR/USD
may rise 14 – 29 pips
Pivot
1.1565
Our preference
Long positions above 1.1565 with targets at 1.1600 & 1.1615 in extension.
Alternative scenario
Below 1.1565 look for further downside with 1.1550 & 1.1535 as targets.
Comment
The RSI advocates for further upside.
GBP/USD
may rise 40 – 60 pips
Pivot
1.3520
Our preference
Long positions above 1.3520 with targets at 1.3600 & 1.3620 in extension.
Alternative scenario
Below 1.3520 look for further downside with 1.3500 & 1.3480 as targets.
Comment
The RSI is bullish and calls for further advance.
USD/CAD
may fall 17 – 32 pips
Pivot
1.2465
Our preference
Short positions below 1.2465 with targets at 1.2425 & 1.2410 in extension.
Alternative scenario
Above 1.2465 look for further upside with 1.2480 & 1.2500 as targets.
Comment
The RSI calls for a drop.
Gold
may rise to 1836.00 – 1847.00
Pivot
1812.00
Our preference
Long positions above 1812.00 with targets at 1836.00 & 1847.00 in extension.
Alternative scenario
Below 1812.00 look for further downside with 1802.00 & 1790.00 as targets.
Comment
The RSI is bullish and calls for further upside.
Crude Oil (WTI)
may rise to 83.40 – 84.40
Pivot
81.05
Our preference
Long positions above 81.05 with targets at 83.40 & 84.40 in extension.
Alternative scenario
Below 81.05 look for further downside with 80.05 & 79.00 as targets.
Comment
The RSI is mixed with a bullish bias.
S&P 500 (CME)
may rise to 4712.00 – 4732.00
Pivot
4674.00
Our preference
Long positions above 4674.00 with targets at 4712.00 & 4732.00 in extension.
Alternative scenario
Below 4674.00 look for further downside with 4656.00 & 4642.00 as targets.
Comment
The RSI is above its neutrality area at 50%.
Nasdaq 100 (CME)
may rise to 16450.00 – 16550.00
Pivot
16240.00
Our preference
Long positions above 16240.00 with targets at 16450.00 & 16550.00 in extension.
Alternative scenario
Below 16240.00 look for further downside with 16170.00 & 16110.00 as targets.
Comment
Even though a continuation of the consolidation cannot be ruled out, its extent should be limited.
Hang Seng (HKFE)
may fall to 24430.00 – 24620.00
Pivot
24975.00
Our preference
Short positions below 24975.00 with targets at 24620.00 & 24430.00 in extension.
Alternative scenario
Above 24975.00 look for further upside with 25230.00 & 25440.00 as targets.
Comment
As long as 24975.00 is resistance, expect a return to 24620.00.
Disclaimer:
This report is prepared and published by Trading Central for all clients of Doo Prime. As a third-party indicator tool, Trading Central is only for your strategic reference during the investment process and does not constitute advice or a recommendation by Doo Prime or Trading Central. Neither Doo Prime nor Trading Central are responsible to bear the relevant legal liabilities for the investment risks arising from your use of this report to make buying and selling decisions.