

1. Daily technical analysis of selected currency pairs
CAD/JPY Bearish

Image Features: forms “Outside Bar (Bearish)” pattern
Target
Opportunity recognized 2021 Oct 01 for the period of up to 12 hours
+0.049 (4.9 pips) price change since the Technical Event at 87.850
Technical Analysis
We found a pattern called Outside Bar (Bearish) on 2021 Oct 01 at 20:00 GMT on a 1 hour chart suggesting the outlook is bearish for up to 12 hours.
A bearish event triggered for Slow Stochastics on 2021 Oct 01 at 22:00 GMT when the %K line crossed below the %D line. The close prices are trading closer to the lower end of the recent high-low price range, which is associated with price decreases.
AUD/JPY Bullish
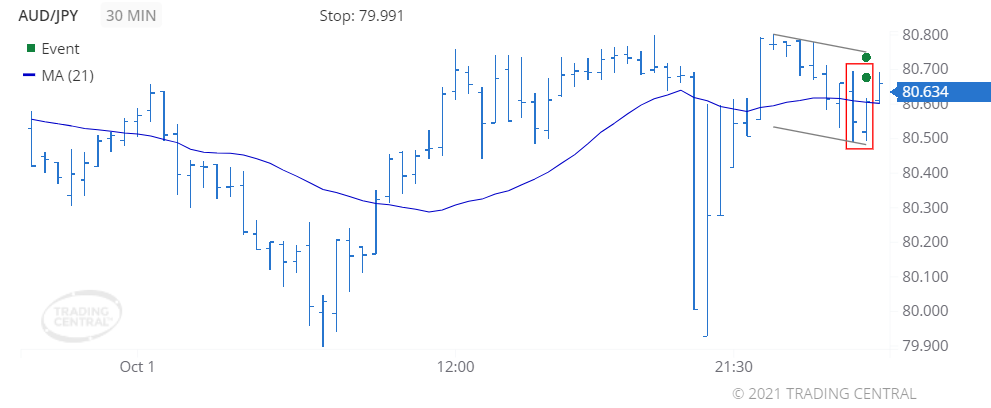
Image Features: forms “Inside Bar (Bullish)” pattern
Target
Opportunity recognized 2021 Oct 04 for the period of up to 12 hours
+0.027 (2.7 pips) price change since the Technical Event at 80.607
Technical Analysis
We found a pattern called Inside Bar (Bullish) on 2021 Oct 04 at 02:30 GMT on a 30 minute chart suggesting the outlook is bullish for up to 12 hours.
The price crossed above its moving average on 2021 Oct 04 at 02:30 GMT signaling a new uptrend has been established.
2. Daily Analyst’s View
EUR/USD
may rise 11 – 26 pips
Pivot
1.1590
Our preference
Long positions above 1.1590 with targets at 1.1620 & 1.1635 in extension.
Alternative scenario
Below 1.1590 look for further downside with 1.1575 & 1.1560 as targets.
Comment
The RSI is bullish and calls for further upside.
GBP/USD
may rise 36 – 56 pips
Pivot
1.3530
Our preference
Long positions above 1.3530 with targets at 1.3610 & 1.3630 in extension.
Alternative scenario
Below 1.3530 look for further downside with 1.3510 & 1.3490 as targets.
Comment
The RSI advocates for further advance.
USD/CAD
may fall 37 – 67 pips
Pivot
1.2670
Our preference
Short positions below 1.2670 with targets at 1.2590 & 1.2560 in extension.
Alternative scenario
Above 1.2670 look for further upside with 1.2700 & 1.2730 as targets.
Comment
The RSI is bearish and calls for further decline.
Gold
may rise to 1774.00 – 1785.00
Pivot
1749.00
Our preference
Long positions above 1749.00 with targets at 1774.00 & 1785.00 in extension.
Alternative scenario
Below 1749.00 look for further downside with 1741.00 & 1733.00 as targets.
Comment
The RSI is bullish and calls for further upside.
Crude Oil (WTI)
may rise to 76.75 – 77.45
Pivot
74.95
Our preference
Long positions above 74.95 with targets at 76.75 & 77.45 in extension.
Alternative scenario
Below 74.95 look for further downside with 74.25 & 73.55 as targets.
Comment
The RSI is bullish and calls for further upside.
S&P 500 (CME)
may rise to 4388.00 – 4410.00
Pivot
4318.00
Our preference
Long positions above 4318.00 with targets at 4388.00 & 4410.00 in extension.
Alternative scenario
Below 4318.00 look for further downside with 4296.00 & 4260.00 as targets.
Comment
The next resistances are at 4388.00 and then at 4410.00.
Nasdaq 100 (CME)
may rise to 14920.00 – 15035.00
Pivot
14650.00
Our preference
Long positions above 14650.00 with targets at 14920.00 & 15035.00 in extension.
Alternative scenario
Below 14650.00 look for further downside with 14530.00 & 14440.00 as targets.
Comment
The RSI shows upside momentum.
Hang Seng (HKFE)
may rise to 24660.00 – 24900.00
Pivot
24280.00
Our preference
Long positions above 24280.00 with targets at 24660.00 & 24900.00 in extension.
Alternative scenario
Below 24280.00 look for further downside with 24070.00 & 23910.00 as targets.
Comment
The RSI is bullish and calls for further advance.
Disclaimer:
This report is prepared and published by Trading Central for all clients of Doo Prime. As a third-party indicator tool, Trading Central is only for your strategic reference during the investment process and does not constitute advice or a recommendation by Doo Prime or Trading Central. Neither Doo Prime nor Trading Central are responsible to bear the relevant legal liabilities for the investment risks arising from your use of this report to make buying and selling decisions.