1. Daily technical analysis of selected currency pairs
AUD/JPY Bearish
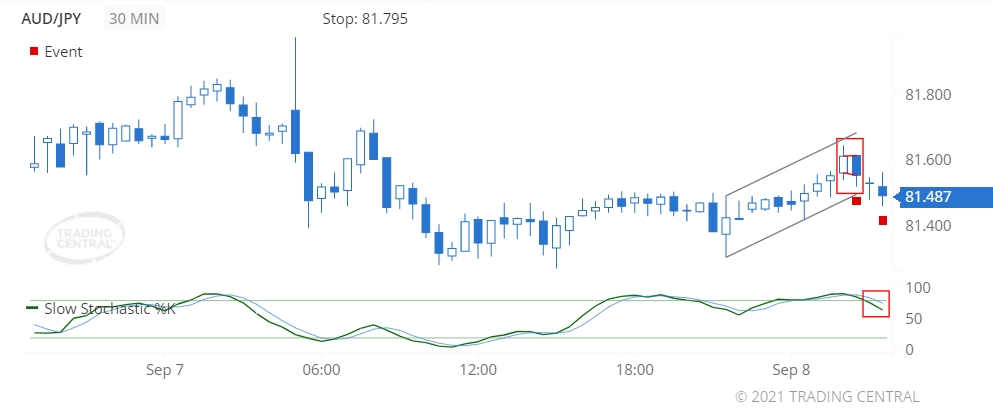
Image Features: forms “Engulfing Line (Bearish)” pattern
Target
Opportunity recognized 2021 Sep 08 for the period of up to 12 hours
-0.068 (6.8 pips) price change since the Technical Event at 81.555
Technical Analysis
We found a pattern called Engulfing Line (Bearish) on 2021 Sep 08 at 02:30 GMT on a 30 minute chart suggesting the outlook is bearish for up to 12 hours.
A bearish event triggered for Slow Stochastics on 2021 Sep 08 at 03:30 GMT when the %K line crossed below the %D line. The close prices are trading closer to the lower end of the recent high-low price range, which is associated with price decreases.
GBP/EUR Bearish
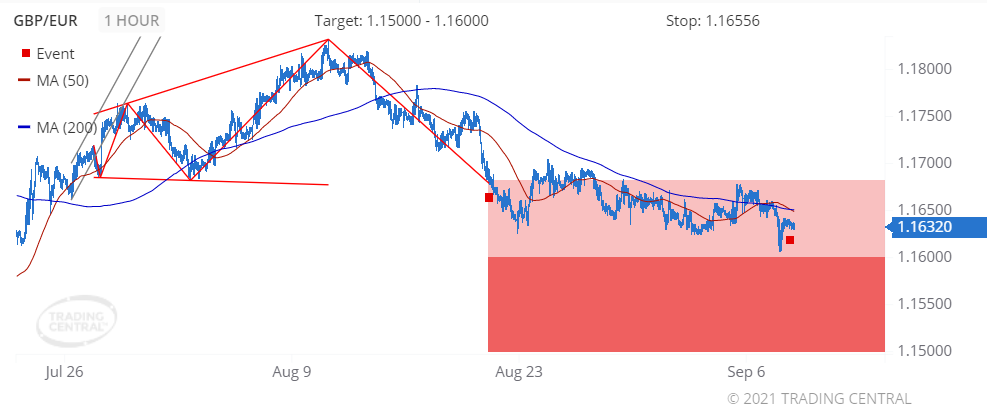
Image Features: forms “Megaphone Top (Bearish)” pattern
Target
Opportunity recognized 2021 Aug 19 for the period of up to 2 weeks
-0.00500 (50 pips) price change since the Technical Event at 1.16820
Technical Analysis
We found a pattern called Megaphone Top on 2021 Aug 19 at 17:00 GMT on a 1 hour chart, providing a target price for up to 2 weeks in the range of 1.15000 to 1.16000.
The faster moving average crossed below the slower moving average on 2021 Sep 07 at 23:00 GMT, signaling a new downtrend has been established.
2. Daily Analyst’s View
EUR/USD
may fall 16 – 31 pips

Pivot
1.1860
Our preference
Short positions below 1.1860 with targets at 1.1825 & 1.1810 in extension.
Alternative scenario
Above 1.1860 look for further upside with 1.1875 & 1.1890 as targets.
Comment
The RSI is bearish and calls for further downside.
GBP/USD
may fall 27 – 47 pips

Pivot
1.3815
Our preference
Short positions below 1.3815 with targets at 1.3750 & 1.3730 in extension.
Alternative scenario
Above 1.3815 look for further upside with 1.3835 & 1.3855 as targets.
Comment
The RSI calls for a new downleg.
USD/CAD
may rise 30 – 60 pips
Pivot
1.2600
Our preference
Long positions above 1.2600 with targets at 1.2670 & 1.2700 in extension.
Alternative scenario
Below 1.2600 look for further downside with 1.2570 & 1.2545 as targets.
Comment
The RSI calls for a new upleg.
Gold
may fall to 1785.00 – 1792.00

Pivot
1807.00
Our preference
Short positions below 1807.00 with targets at 1792.00 & 1785.00 in extension.
Alternative scenario
Above 1807.00 look for further upside with 1815.00 & 1821.00 as targets.
Comment
The RSI is mixed to bearish.
Crude Oil (WTI)
may fall to 67.10 – 67.65
Pivot
68.80
Our preference
Short positions below 68.80 with targets at 67.65 & 67.10 in extension.
Alternative scenario
Above 68.80 look for further upside with 69.40 & 69.80 as targets.
Comment
As long as 68.80 is resistance, look for choppy price action with a bearish bias.
S&P 500 (CME)
may fall to 4502.00 – 4510.00
Pivot
4528.00
Our preference
Short positions below 4528.00 with targets at 4510.00 & 4502.00 in extension.
Alternative scenario
Above 4528.00 look for further upside with 4540.00 & 4548.00 as targets.
Comment
As long as the resistance at 4528.00 is not surpassed, the risk of the break below 4510.00 remains high.
Nasdaq 100 (CME)
may rise to 15705.00 – 15740.00
Pivot
15630.00
Our preference
Long positions above 15630.00 with targets at 15705.00 & 15740.00 in extension.
Alternative scenario
Below 15630.00 look for further downside with 15605.00 & 15580.00 as targets.
Comment
The RSI is around its neutrality area at 50%.
Hang Seng (HKFE)
may rise to 26480.00 – 26620.00
Pivot
26165.00
Our preference
Long positions above 26165.00 with targets at 26480.00 & 26620.00 in extension.
Alternative scenario
Below 26165.00 look for further downside with 26030.00 & 25890.00 as targets.
Comment
The RSI is mixed with a bullish bias.
Disclaimer:
This report is prepared and published by Trading Central for all clients of Doo Prime. As a third-party indicator tool, Trading Central is only for your strategic reference during the investment process and does not constitute advice or a recommendation by Doo Prime or Trading Central. Neither Doo Prime nor Trading Central are responsible to bear the relevant legal liabilities for the investment risks arising from your use of this report to make buying and selling decisions.