1. Daily technical analysis of selected currency pairs
EUR/CAD Bullish
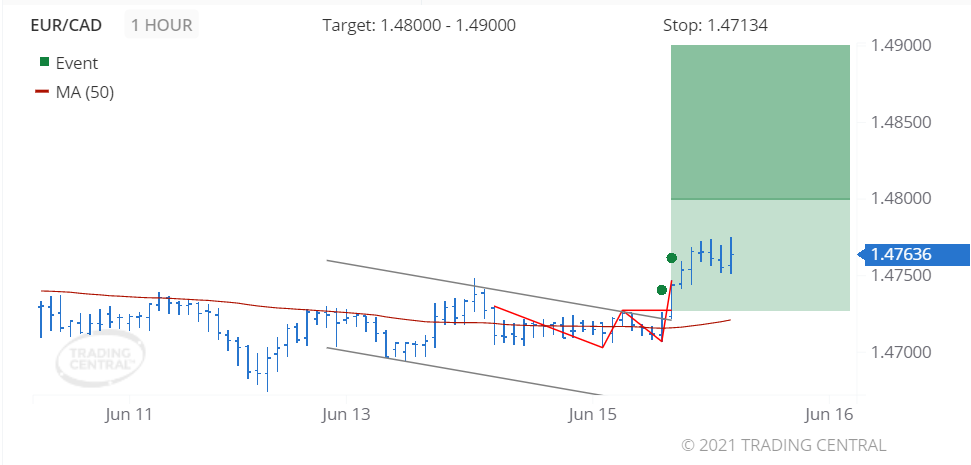
Image Features: forms “Double Bottom (Bullish)” pattern
Target
Opportunity recognized 2021 Jun 15 for the period of up to 48 hours
+0.00362 (36.2 pips) price change since the Technical Event at 1.47274
Technical Analysis
We found a pattern called Double Bottom on 2021 Jun 15 at 08:00 GMT on a 1 hour chart, providing a target price for up to 48 hours in the range of 1.48000 to 1.49000.
The price crossed above its moving average on 2021 Jun 15 at 07:00 GMT signaling a new uptrend has been established.
USD/AUD Bearish
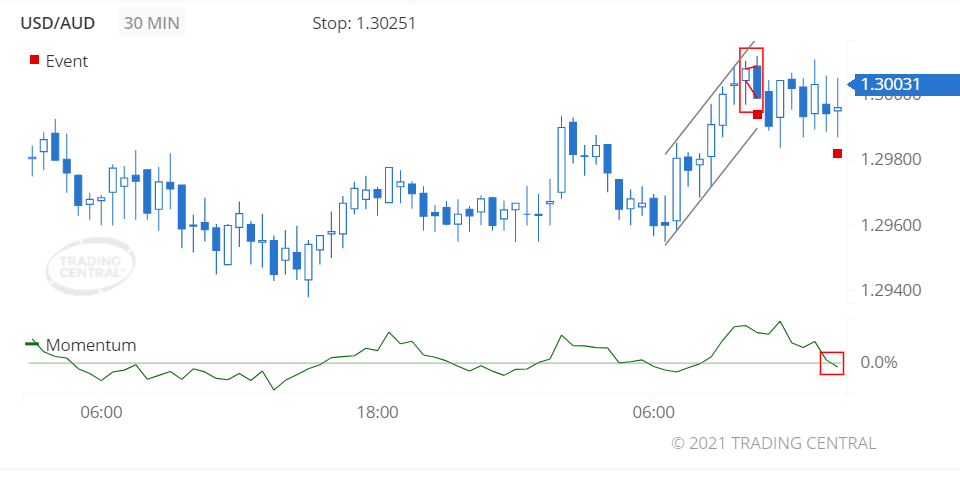
Image Features: forms “Engulfing Line (Bearish)” pattern
Target
Opportunity recognized 2021 Jun 15 for the period of up to 12 hours
+0.00041 (4.1 pips) price change since the Technical Event at 1.29990
Technical Analysis
We found a pattern called Engulfing Line (Bearish) on 2021 Jun 15 at 10:30 GMT on a 30 minute chart suggesting the outlook is bearish for up to 12 hours.
The Momentum oscillator crossed below 0 on 2021 Jun 15 at 14:00 GMT, thereby signaling a new accelerating downtrend.
2. Daily Analyst’s View
EUR/USD
may fall 38 – 53 pips
Pivot
1.2145
Our preference
Short positions below 1.2145 with targets at 1.2090 & 1.2075 in extension.
Alternative scenario
Above 1.2145 look for further upside with 1.2170 & 1.2190 as targets.
Comment
The RSI is mixed to bearish.
GBP/USD
may fall 49 – 69 pips
Pivot
1.4100
Our preference
Short positions below 1.4100 with targets at 1.4035 & 1.4015 in extension.
Alternative scenario
Above 1.4100 look for further upside with 1.4125 & 1.4145 as targets.
Comment
The RSI lacks upward momentum.
USD/CAD
may rise 57 – 77 pips
Pivot
1.2125
Our preference
Long positions above 1.2125 with targets at 1.2230 & 1.2250 in extension.
Alternative scenario
Below 1.2125 look for further downside with 1.2105 & 1.2090 as targets.
Comment
The RSI is mixed with a bullish bias.
Gold
may rise to 1878.00 – 1889.00
Pivot
1858.00
Our preference
Long positions above 1858.00 with targets at 1878.00 & 1889.00 in extension.
Alternative scenario
Below 1858.00 look for further downside with 1844.00 & 1834.00 as targets.
Comment
The RSI is mixed to bullish.
Crude Oil (WTI)
may rise to 71.80 – 72.20
Pivot
71.15
Our preference
Long positions above 71.15 with targets at 71.80 & 72.20 in extension.
Alternative scenario
Below 71.15 look for further downside with 70.90 & 70.70 as targets.
Comment
The break above the resistance at 71.15 triggered an upward acceleration to 71.80.
S&P 500 (CME)
may rise to 4269.00 – 4279.00
Pivot
4237.00
Our preference
Long positions above 4237.00 with targets at 4269.00 & 4279.00 in extension.
Alternative scenario
Below 4237.00 look for further downside with 4225.00 & 4215.00 as targets.
Comment
The RSI is bullish and calls for further advance.
Nasdaq 100 (CME)
may rise to 14225.00 – 14300.00
Pivot
14040.00
Our preference
Long positions above 14040.00 with targets at 14225.00 & 14300.00 in extension.
Alternative scenario
Below 14040.00 look for further downside with 13980.00 & 13955.00 as targets.
Comment
The RSI is bullish and calls for further upside.
Hang Seng (HKFE)
may fall to 28210.00 – 28350.00
Pivot
28650.00
Our preference
Short positions below 28650.00 with targets at 28350.00 & 28210.00 in extension.
Alternative scenario
Above 28650.00 look for further upside with 28760.00 & 28915.00 as targets.
Comment
The RSI is below its neutrality area at 50%
Disclaimer:
This report is prepared and published by Trading Central for all clients of Doo Prime. As a third-party indicator tool, Trading Central is only for your strategic reference during the investment process and does not constitute advice or a recommendation by Doo Prime or Trading Central. Neither Doo Prime nor Trading Central are responsible to bear the relevant legal liabilities for the investment risks arising from your use of this report to make buying and selling decisions.