1. Daily technical analysis of selected currency pairs
GBP/EUR Bearish

Image Features: forms “Inside Bar (Bearish)” pattern
Target
Opportunity recognized 2021 Jun 02 for the period of up to 48 hours
-0.00010 (1 pips) price change since the Technical Event at 1.16060
Technical Analysis
We found a pattern called Inside Bar (Bearish) on 2021 Jun 02 at 17:00 GMT on a 4 hour chart suggesting the outlook is bearish for up to 48 hours.
The price crossed below its moving average on 2021 Jun 02 at 17:00 GMT signaling a new downtrend has been established.
USD/JPY Bearish
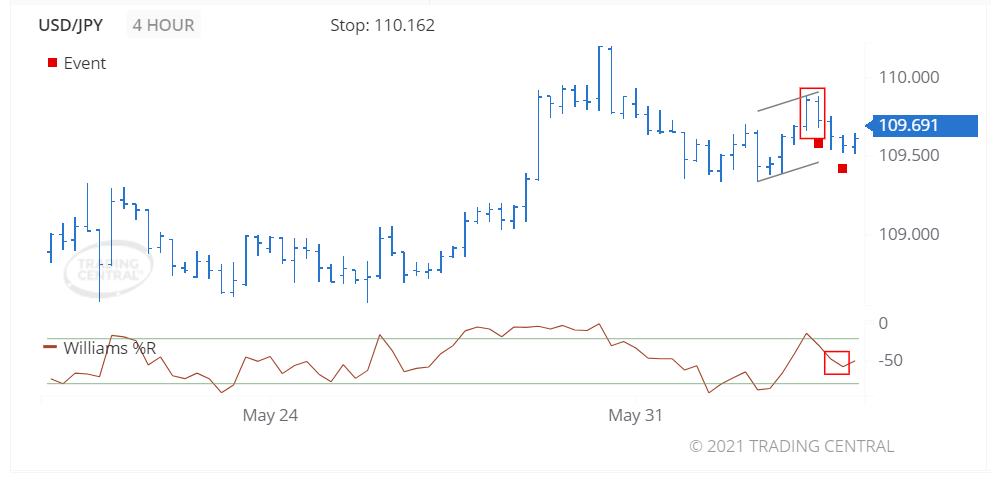
Image Features: forms “Inside Bar (Bearish)” pattern
Target
Opportunity recognized 2021 Jun 02 for the period of up to 48 hours
-0.035 (3.5 pips) price change since the Technical Event at 109.726
Technical Analysis
We found a pattern called Inside Bar (Bearish) on 2021 Jun 02 at 13:00 GMT on a 4 hour chart suggesting the outlook is bearish for up to 48 hours.
The Williams %R indicator triggered a bearish signal on 2021 Jun 02 at 21:00 GMT, having fallen out of overbought (-20 level) and continued on to cross below the -50 level.
2. Daily Analyst’s View
EUR/USD
may fall 8 – 23 pips
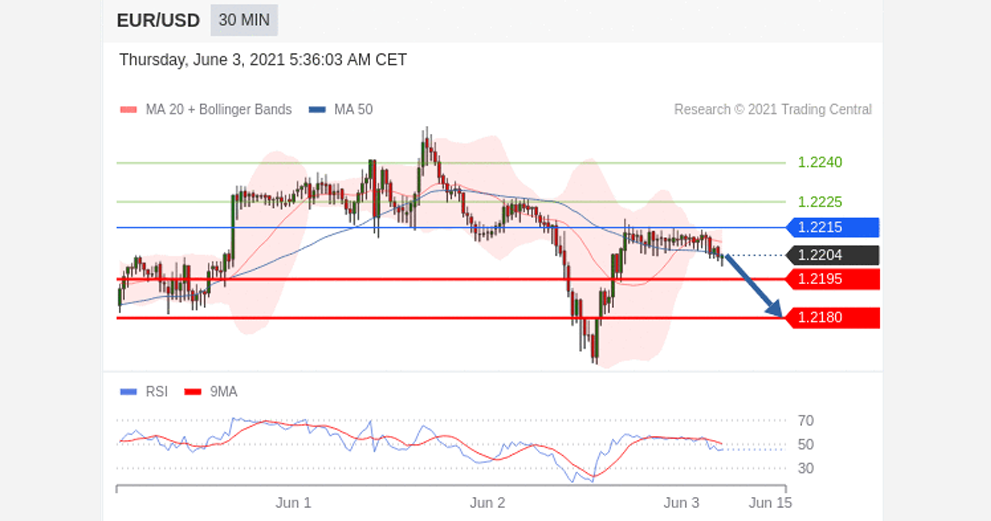
Pivot
1.2215
Our preference
Short positions below 1.2215 with targets at 1.2195 & 1.2180 in extension.
Alternative scenario
Above 1.2215 look for further upside with 1.2225 & 1.2240 as targets.
Comment
A break below 1.2195 would trigger a drop towards 1.2180.
GBP/USD
may rise 11 – 26 pips
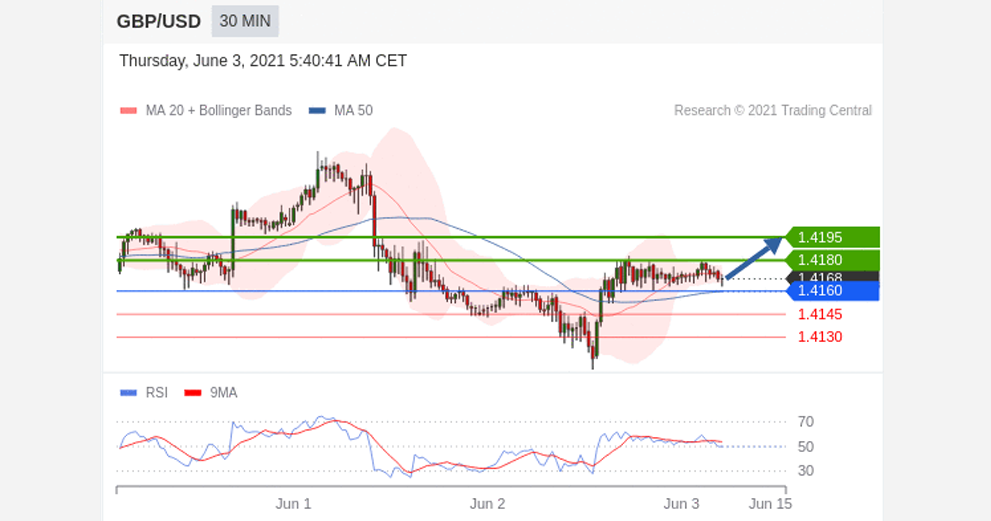
Pivot
1.4160
Our preference
Long positions above 1.4160 with targets at 1.4180 & 1.4195 in extension.
Alternative scenario
Below 1.4160 look for further downside with 1.4145 & 1.4130 as targets.
Comment
A support base at 1.4160 has formed and has allowed for a temporary stabilisation.
USD/CAD
may fall 15 – 30 pips
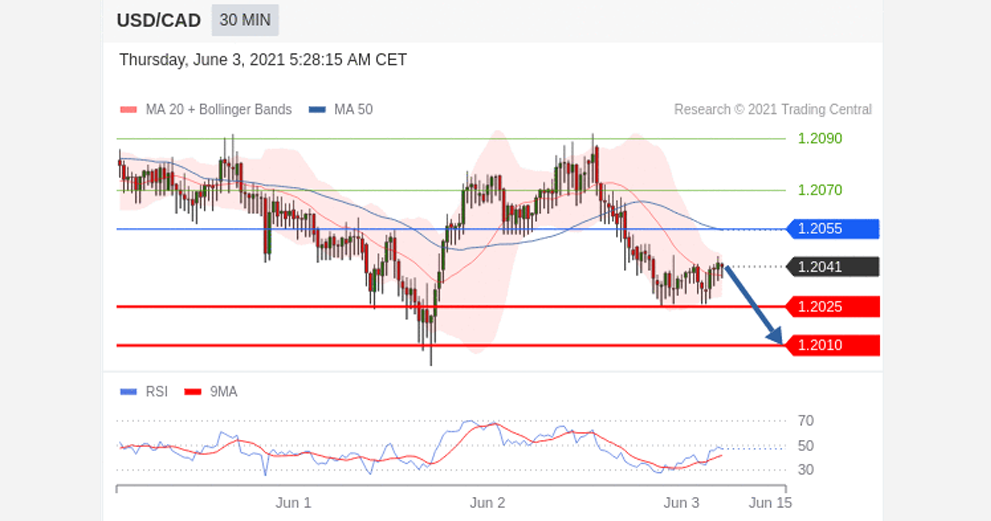
Pivot
1.2055
Our preference
Short positions below 1.2055 with targets at 1.2025 & 1.2010 in extension.
Alternative scenario
Above 1.2055 look for further upside with 1.2070 & 1.2090 as targets.
Comment
As long as the resistance at 1.2055 is not surpassed, the risk of the break below 1.2025 remains high.
Gold
may rise to 1916.00 – 1923.00
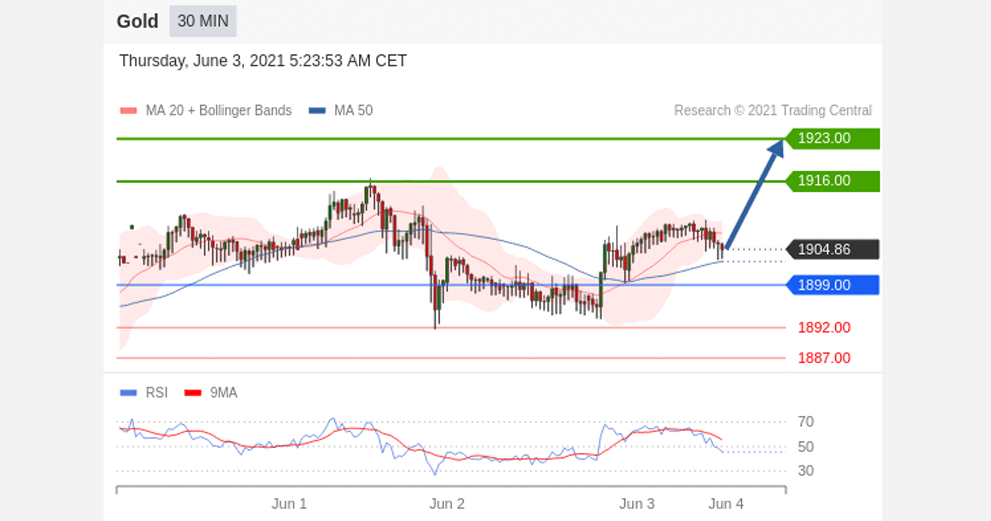
Pivot
1899.00
Our preference
Long positions above 1899.00 with targets at 1916.00 & 1923.00 in extension.
Alternative scenario
Below 1899.00 look for further downside with 1892.00 & 1887.00 as targets.
Comment
The RSI is mixed to bullish.
Crude Oil (WTI)
may rise to 69.80 – 70.60
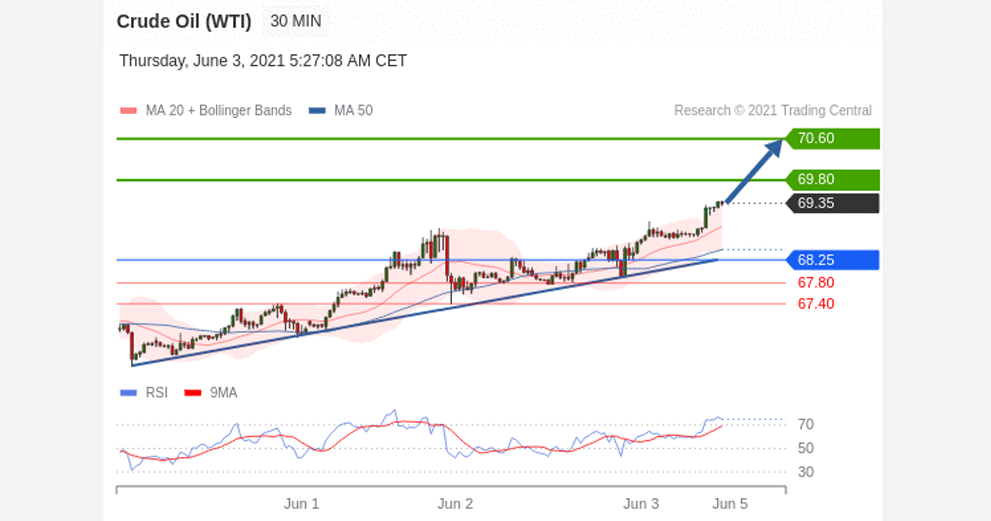
Pivot
68.25
Our preference
Long positions above 68.25 with targets at 69.80 & 70.60 in extension.
Alternative scenario
Below 68.25 look for further downside with 67.80 & 67.40 as targets.
Comment
The RSI shows upside momentum.
S&P 500 (CME)
may rise to 4215.00 – 4230.00
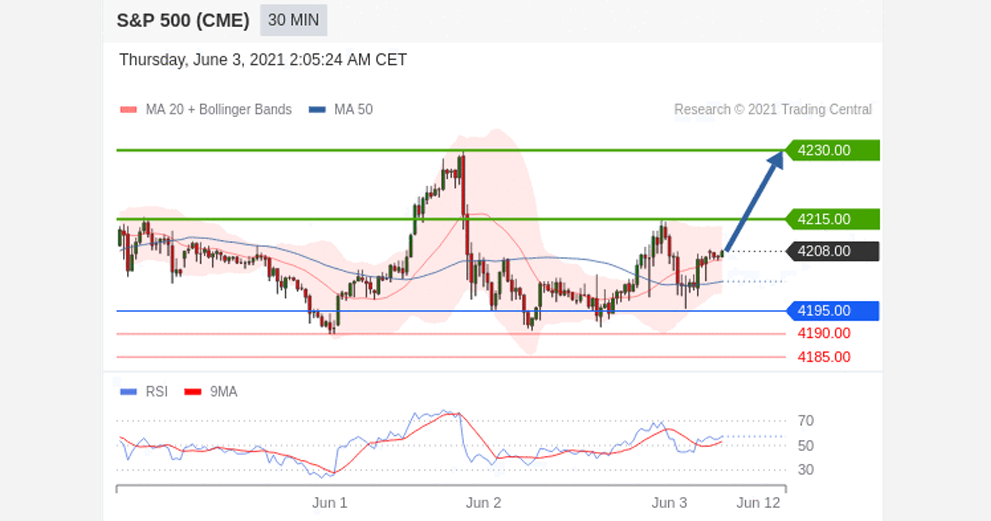
Pivot
4195.00
Our preference
Long positions above 4195.00 with targets at 4215.00 & 4230.00 in extension.
Alternative scenario
Below 4195.00 look for further downside with 4190.00 & 4185.00 as targets.
Comment
The RSI has just landed on its neutrality area at 50% and is turning up.
Nasdaq 100 (CME)
may rise to 13710.00 – 13770.00
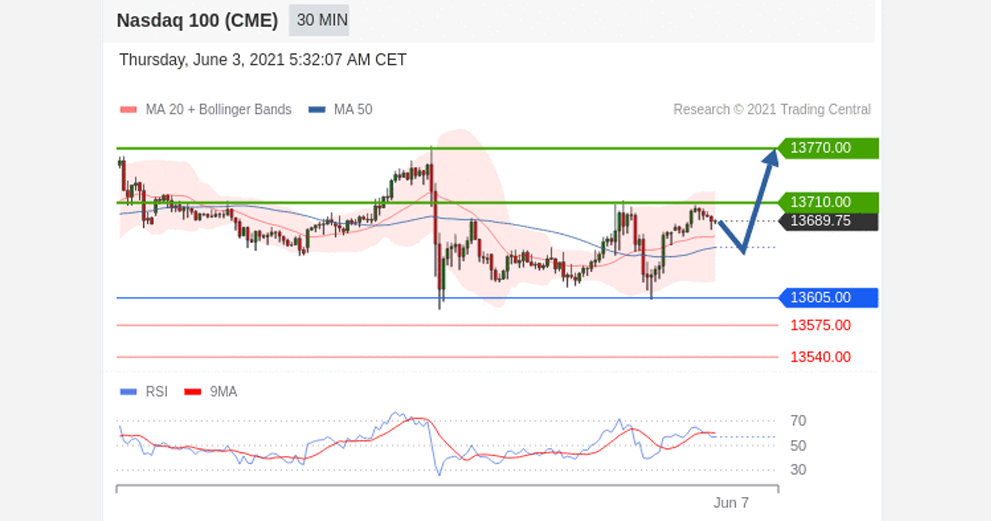
Pivot
13605.00
Our preference
Long positions above 13605.00 with targets at 13710.00 & 13770.00 in extension.
Alternative scenario
Below 13605.00 look for further downside with 13575.00 & 13540.00 as targets.
Comment
The RSI is mixed with a bullish bias.
Hang Seng (HKFE)
may rise to 29400.00 – 29625.00
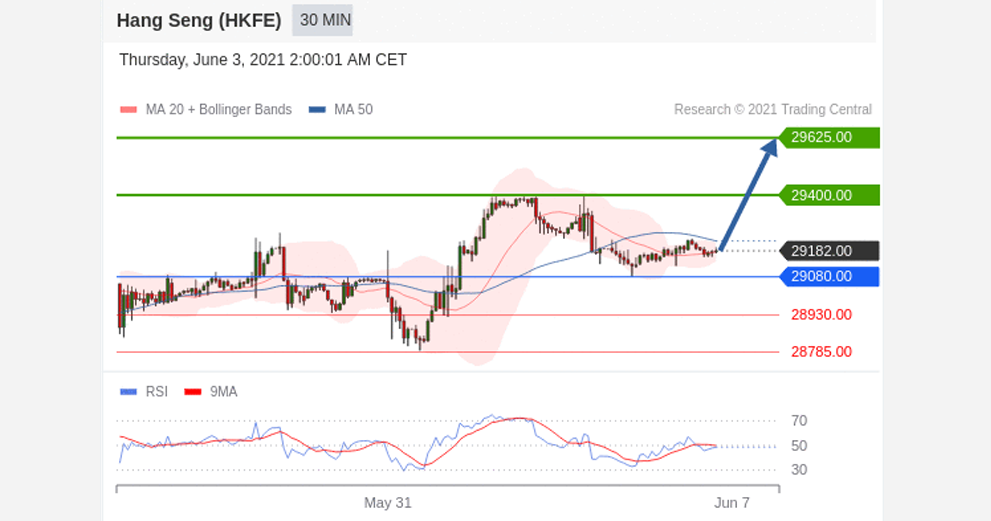
Pivot
29080.00
Our preference
Long positions above 29080.00 with targets at 29400.00 & 29625.00 in extension.
Alternative scenario
Below 29080.00 look for further downside with 28930.00 & 28785.00 as targets.
Comment
A support base at 29080.00 has formed and has allowed for a temporary stabilisation.
Disclaimer:
This report is prepared and published by Trading Central for all clients of Doo Prime. As a third-party indicator tool, Trading Central is only for your strategic reference during the investment process and does not constitute advice or a recommendation by Doo Prime or Trading Central. Neither Doo Prime nor Trading Central are responsible to bear the relevant legal liabilities for the investment risks arising from your use of this report to make buying and selling decisions.