

Strong U.S. economic data led to fluctuations in gold prices. Spot gold closed higher on the last trading day of the first week of the year but experienced its first weekly decline in nearly four weeks.
The situation in the Middle East influenced crude oil prices, and in the first week of the new year, crude oil prices rose, both setting new closing highs for over a week.
Gold >>
On last Friday, gold initially dropped to 2024.39 and then rebounded to an intraday high of 2063.98, with a fluctuation range of nearly USD 40. Spot gold rose by 0.09%, closing at USD 2045.30 per ounce.
However, due to the overall strength of the U.S. dollar and rising bond yields, gold experienced its first weekly decline in four weeks, dropping nearly 1% compared to the previous week.
In the early session of the U.S. market on Friday, gold prices sharply declined, reaching a three-week low. However, a strong rebound followed, leading to a strengthening of gold prices.
The U.S. December employment situation report revealed a key non-farm employment increase of 216,000, surpassing the expected 170,000, with the revised increase in November reported as 173,000.
The unemployment rate for December in the U.S. was 3.7%, lower than the market’s general prediction of 3.8%. The unemployment rate reported in November was 3.7%.
From a technical perspective, gold first rapidly fell, piercing through the 2030 level and reaching around 2024, before quickly stabilizing and rebounding.
During the hourly closing, it surged back above the 2040 level, entered a sideways consolidation. After 23:00, gold prices accelerated their rise, breaking through the 2050 level and reaching around 2063, exhibiting strong momentum.
In the early morning, gold prices oscillated, retraced, and then sharply fell, returning to around the 2045 level before closing in a fluctuating manner.
Technical Analysis:
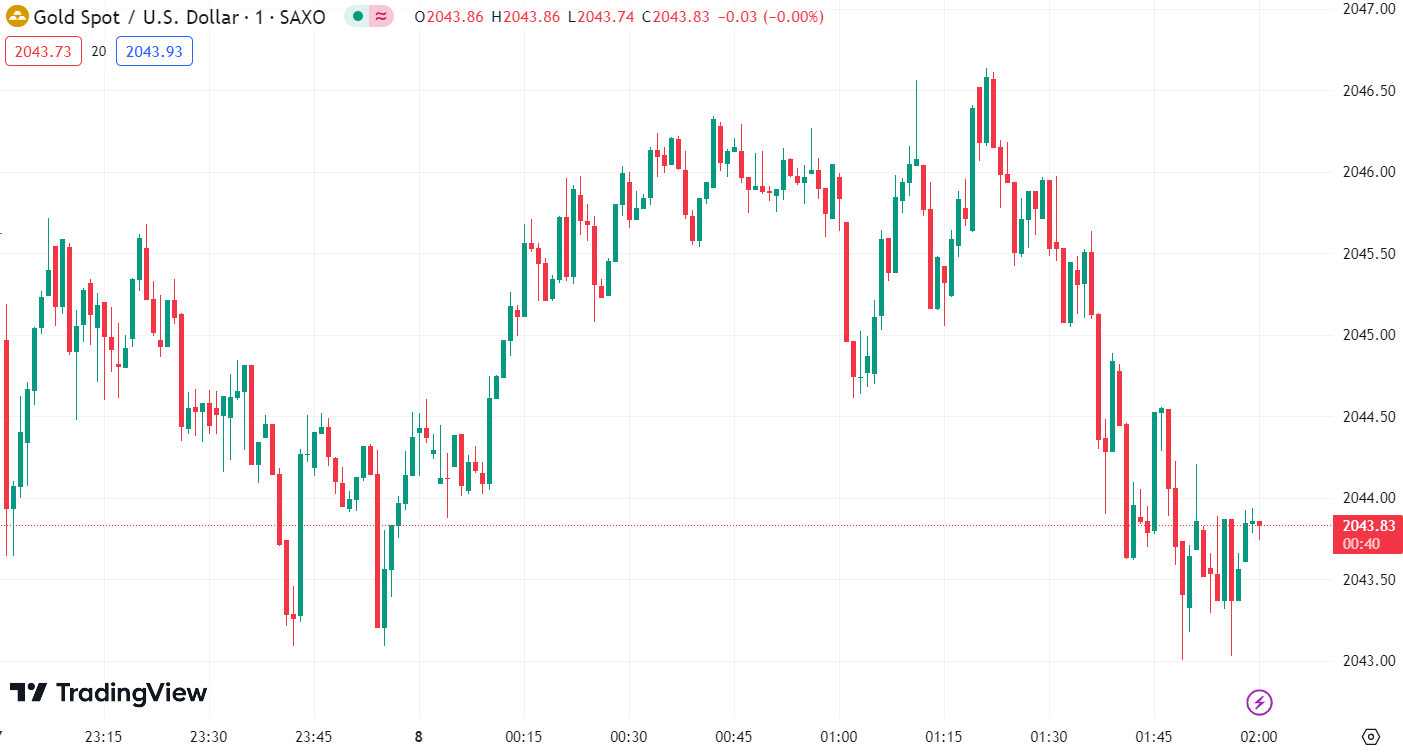
Today’s short-term strategy for gold suggests prioritizing short positions during rebounds, with long positions considered as a secondary approach during pullbacks.
- Key resistance levels to watch in the short term are around 2060-2065.
- Key support levels to watch in the short term are around 2036-2030.
WTI Crude Oil >>
Due to the ongoing tension in the Middle East, international crude oil prices surged over 2% during intraday trading, maintaining the upward momentum throughout the week. U.S. crude oil briefly surpassed the USD 74 mark, closing with a 2.28% gain at USD 73.87 per barrel.
Brent crude oil also rose by 1.49%, closing at USD 78.97 per barrel. Both WTI (West Texas Intermediate) and Brent crude oil achieved their highest closing levels in over a week.
Last week, U.S. crude oil saw an accumulated increase of approximately 3%, while Brent crude oil rose by 2.23%, marking the largest weekly gain since October 13.
The escalation of the conflict between Israel and Hamas, along with heightened tensions in neighboring countries, contributed to the overall geopolitical uncertainty.
This week, the rise in crude oil prices, amid a rebound in the U.S. dollar, was primarily attributed to the tense situation in the Middle East, further fueled by the closure of Libya’s largest oil field.
From a technical standpoint, oil prices experienced a bullish rebound amidst volatile trading. During the Asian and European sessions, prices showed a slight oscillation before gradually rising, with support around the USD 72.4 level.
In the late U.S. session, there was an accelerated upward movement, breaking through the USD 73 level and reaching near the USD 74 level, closing strongly.
Technical Analysis:
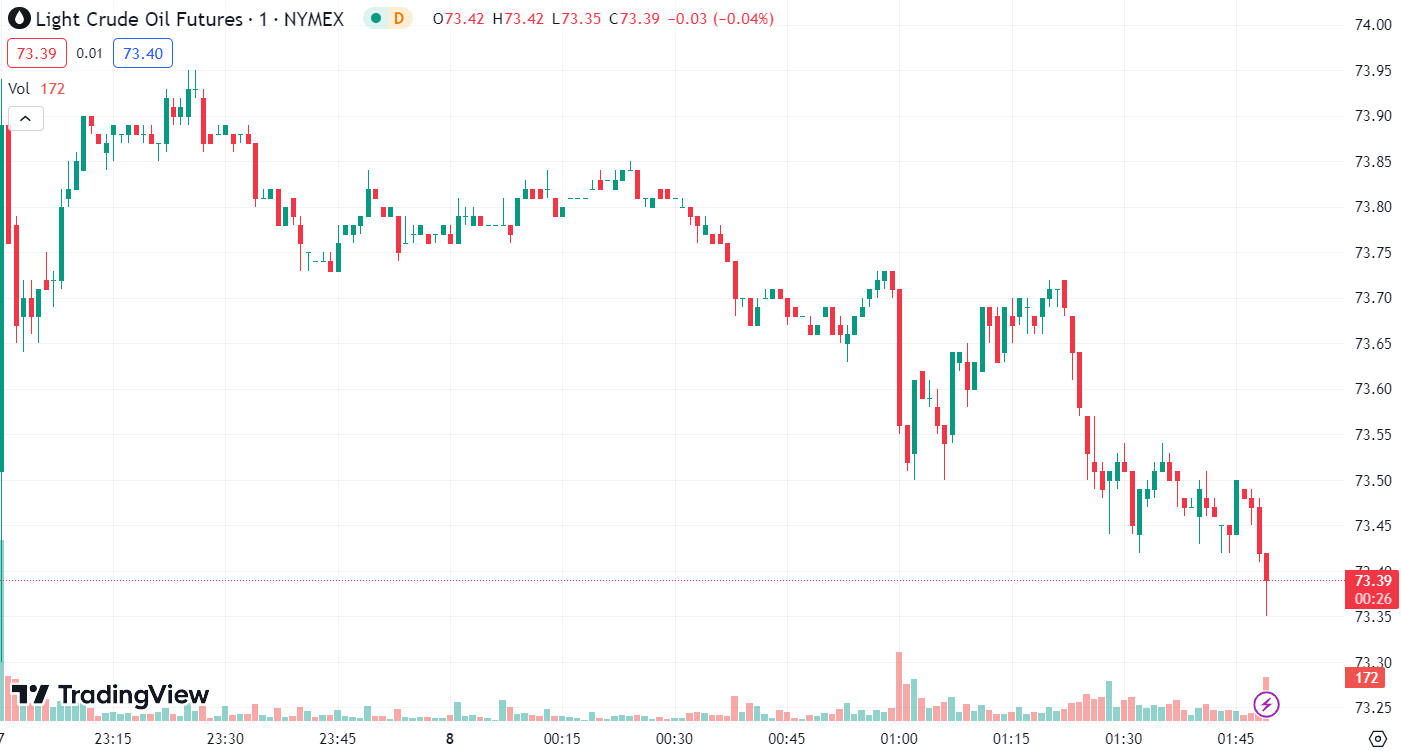
Today’s crude oil trading strategy suggests prioritizing short positions during rebounds, with long positions considered as a secondary approach during pullbacks.
- Key resistance levels to monitor in the short term are around 75.0-76.0.
- Key support levels to monitor in the short term are around 72.0-71.0.
Forward-looking Statements
This article contains “forward-looking statements” and may be identified by the use of forward-looking terminology such as “anticipate”, “believe”, “continue”, “could”, “estimate”, “expect”, “hope”, “intend”, “may”, “might”, “plan”, “potential”, “predict”, “should”, or “will”, or other variations thereon or comparable terminology. However, the absence of such terminology does not mean that a statement is not forward-looking. In particular, statements about the expectations, beliefs, plans, objectives, assumptions, future events, or future performance of Doo Prime will be generally assumed as forward-looking statements.
Doo Prime has provided these forward-looking statements based on all current information available to Doo Prime and Doo Prime’s current expectations, assumptions, estimates, and projections. While Doo Prime believes these expectations, assumptions, estimations, and projections are reasonable, these forward-looking statements are only predictions and involve known and unknown risks and uncertainties, many of which are beyond Doo Prime’s control. Such risks and uncertainties may cause results, performance, or achievements materially different from those expressed or implied by the forward-looking statements.
Doo Prime does not provide any representation or warranty on the reliability, accuracy, or completeness of such statements. Doo Prime is not obliged to provide or release any updates or revisions to any forward-looking statements.
Disclaimer
While every effort has been made to ensure the accuracy of the information in this document, DOO Prime does not warrant or guarantee the accuracy, completeness or reliability of this information. DOO Prime does not accept responsibility for any losses or damages arising directly or indirectly, from the use of this document. The material contained in this document is provided solely for general information and educational purposes and is not and should not be construed as, an offer to buy or sell, or as a solicitation of an offer to buy or sell, securities, futures, options, bonds or any other relevant financial instruments or investments. Nothing in this document should be taken as making any recommendations or providing any investment or other advice with respect to the purchase, sale or other disposition of financial instruments, any related products or any other products, securities or investments. Trading involves risk and you are advised to exercise caution in relation to the report. Before making any investment decision, prospective investors should seek advice from their own financial advisers, take into account their individual financial needs and circumstances and carefully consider the risks associated with such investment decision.

